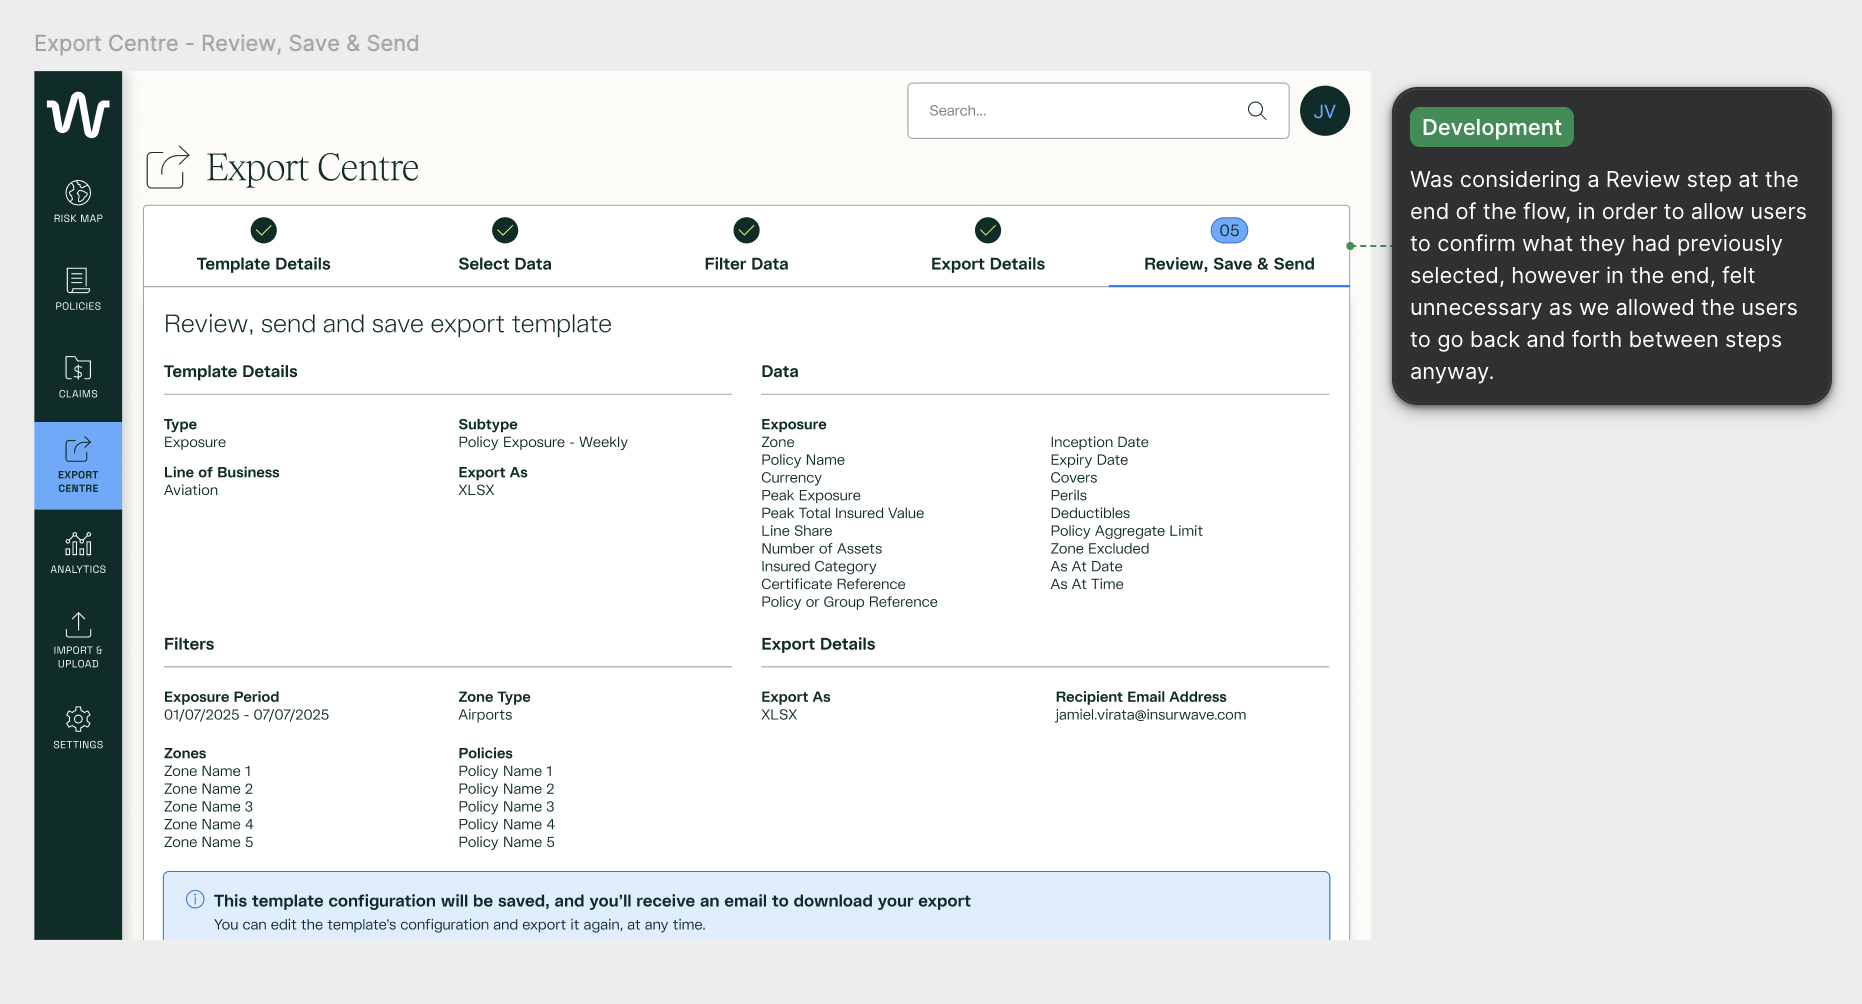
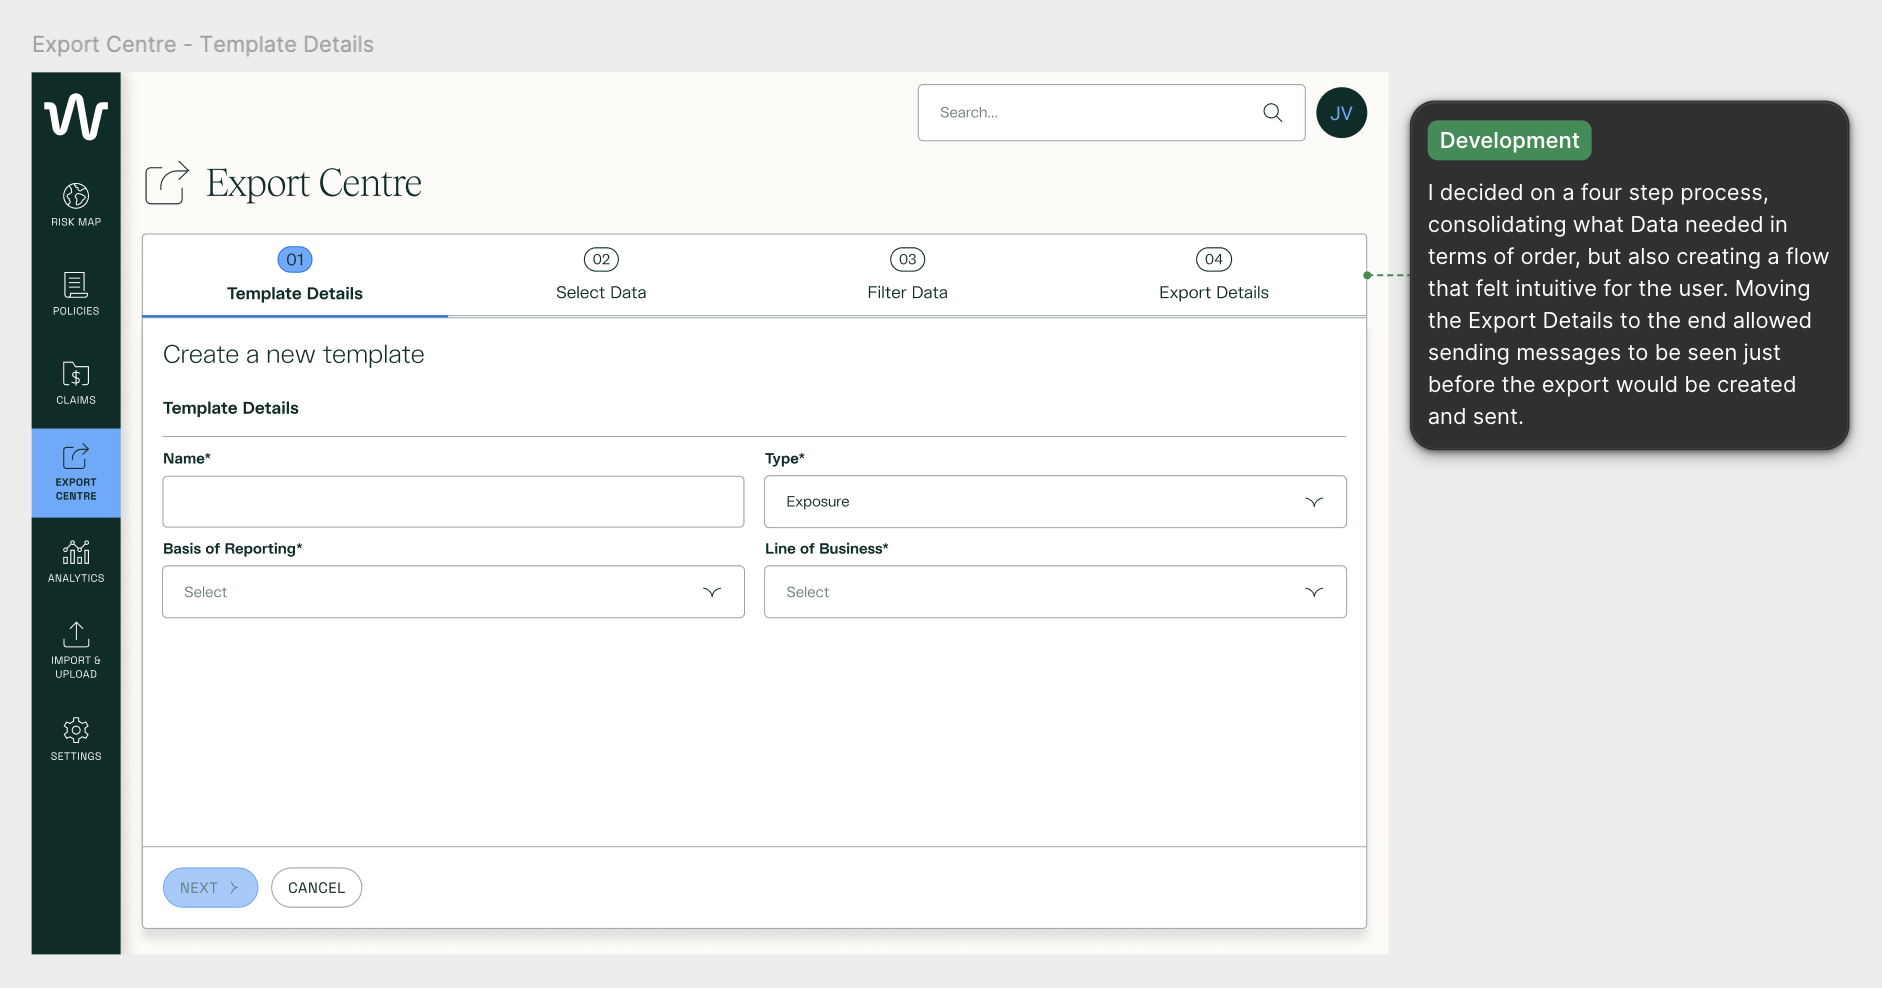
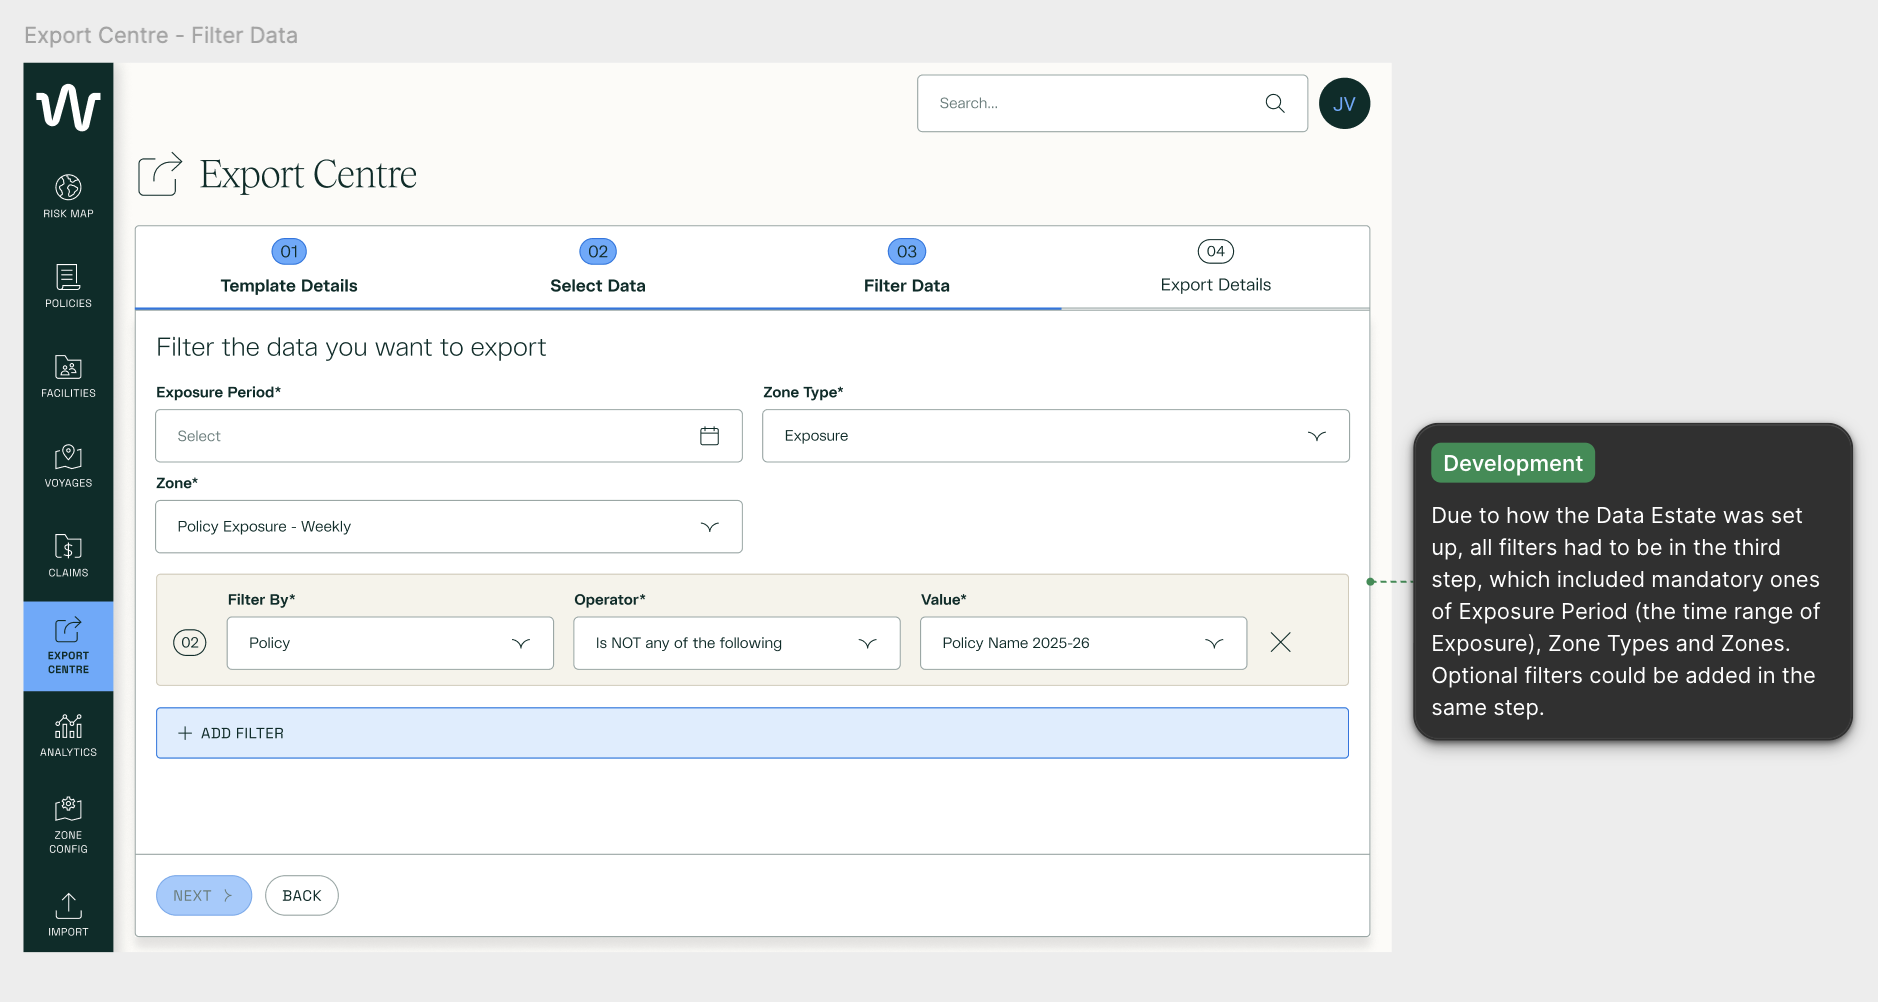
CREATING THE EXPORT CENTRE
Role
Senior UX/UI Designer
Timeline
Jul - Dec 2025
Team
1 PM, 1 Designer, 9 engineers
Platform
Web App
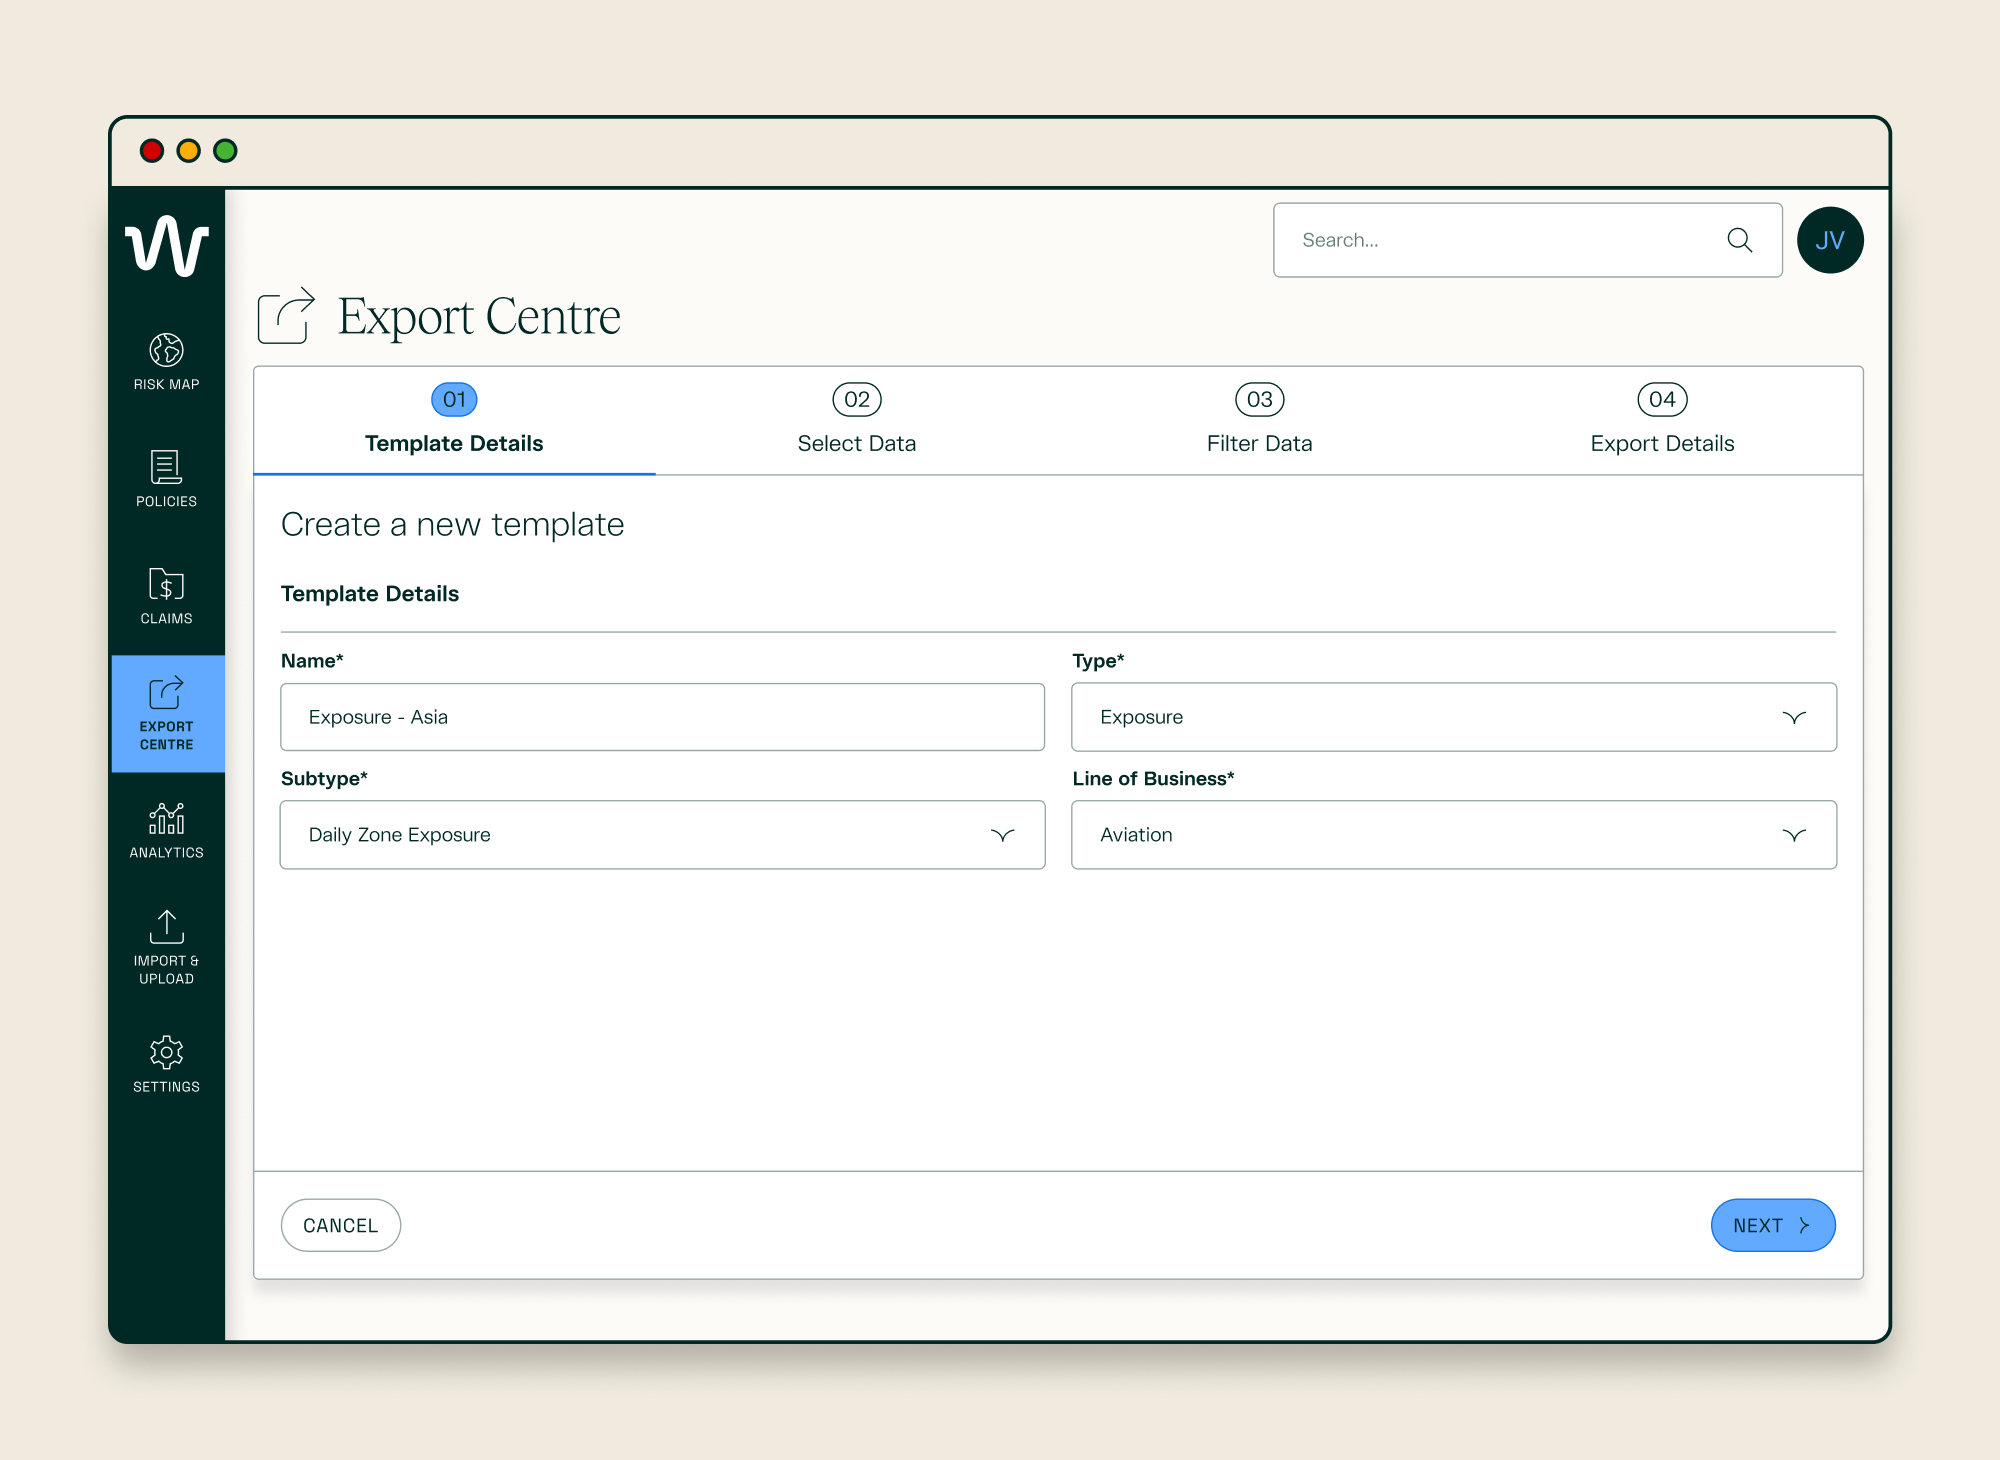
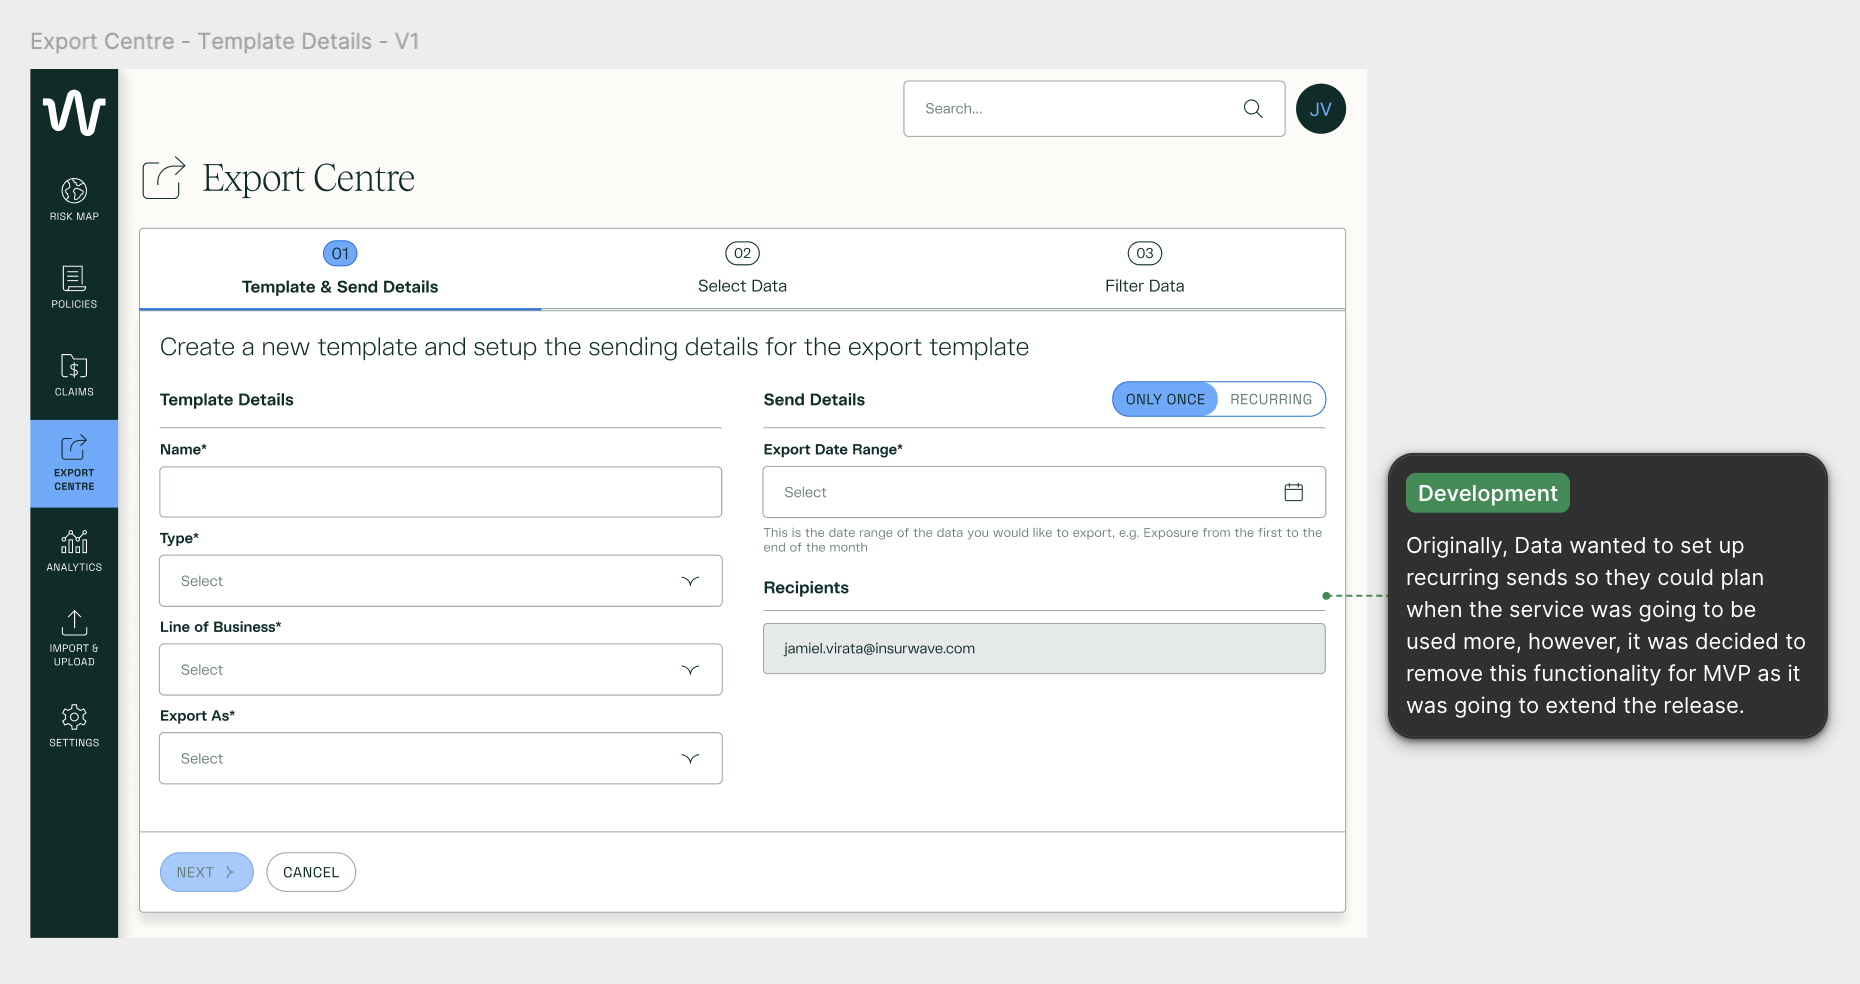
Export Centre - Create Template - Template Details
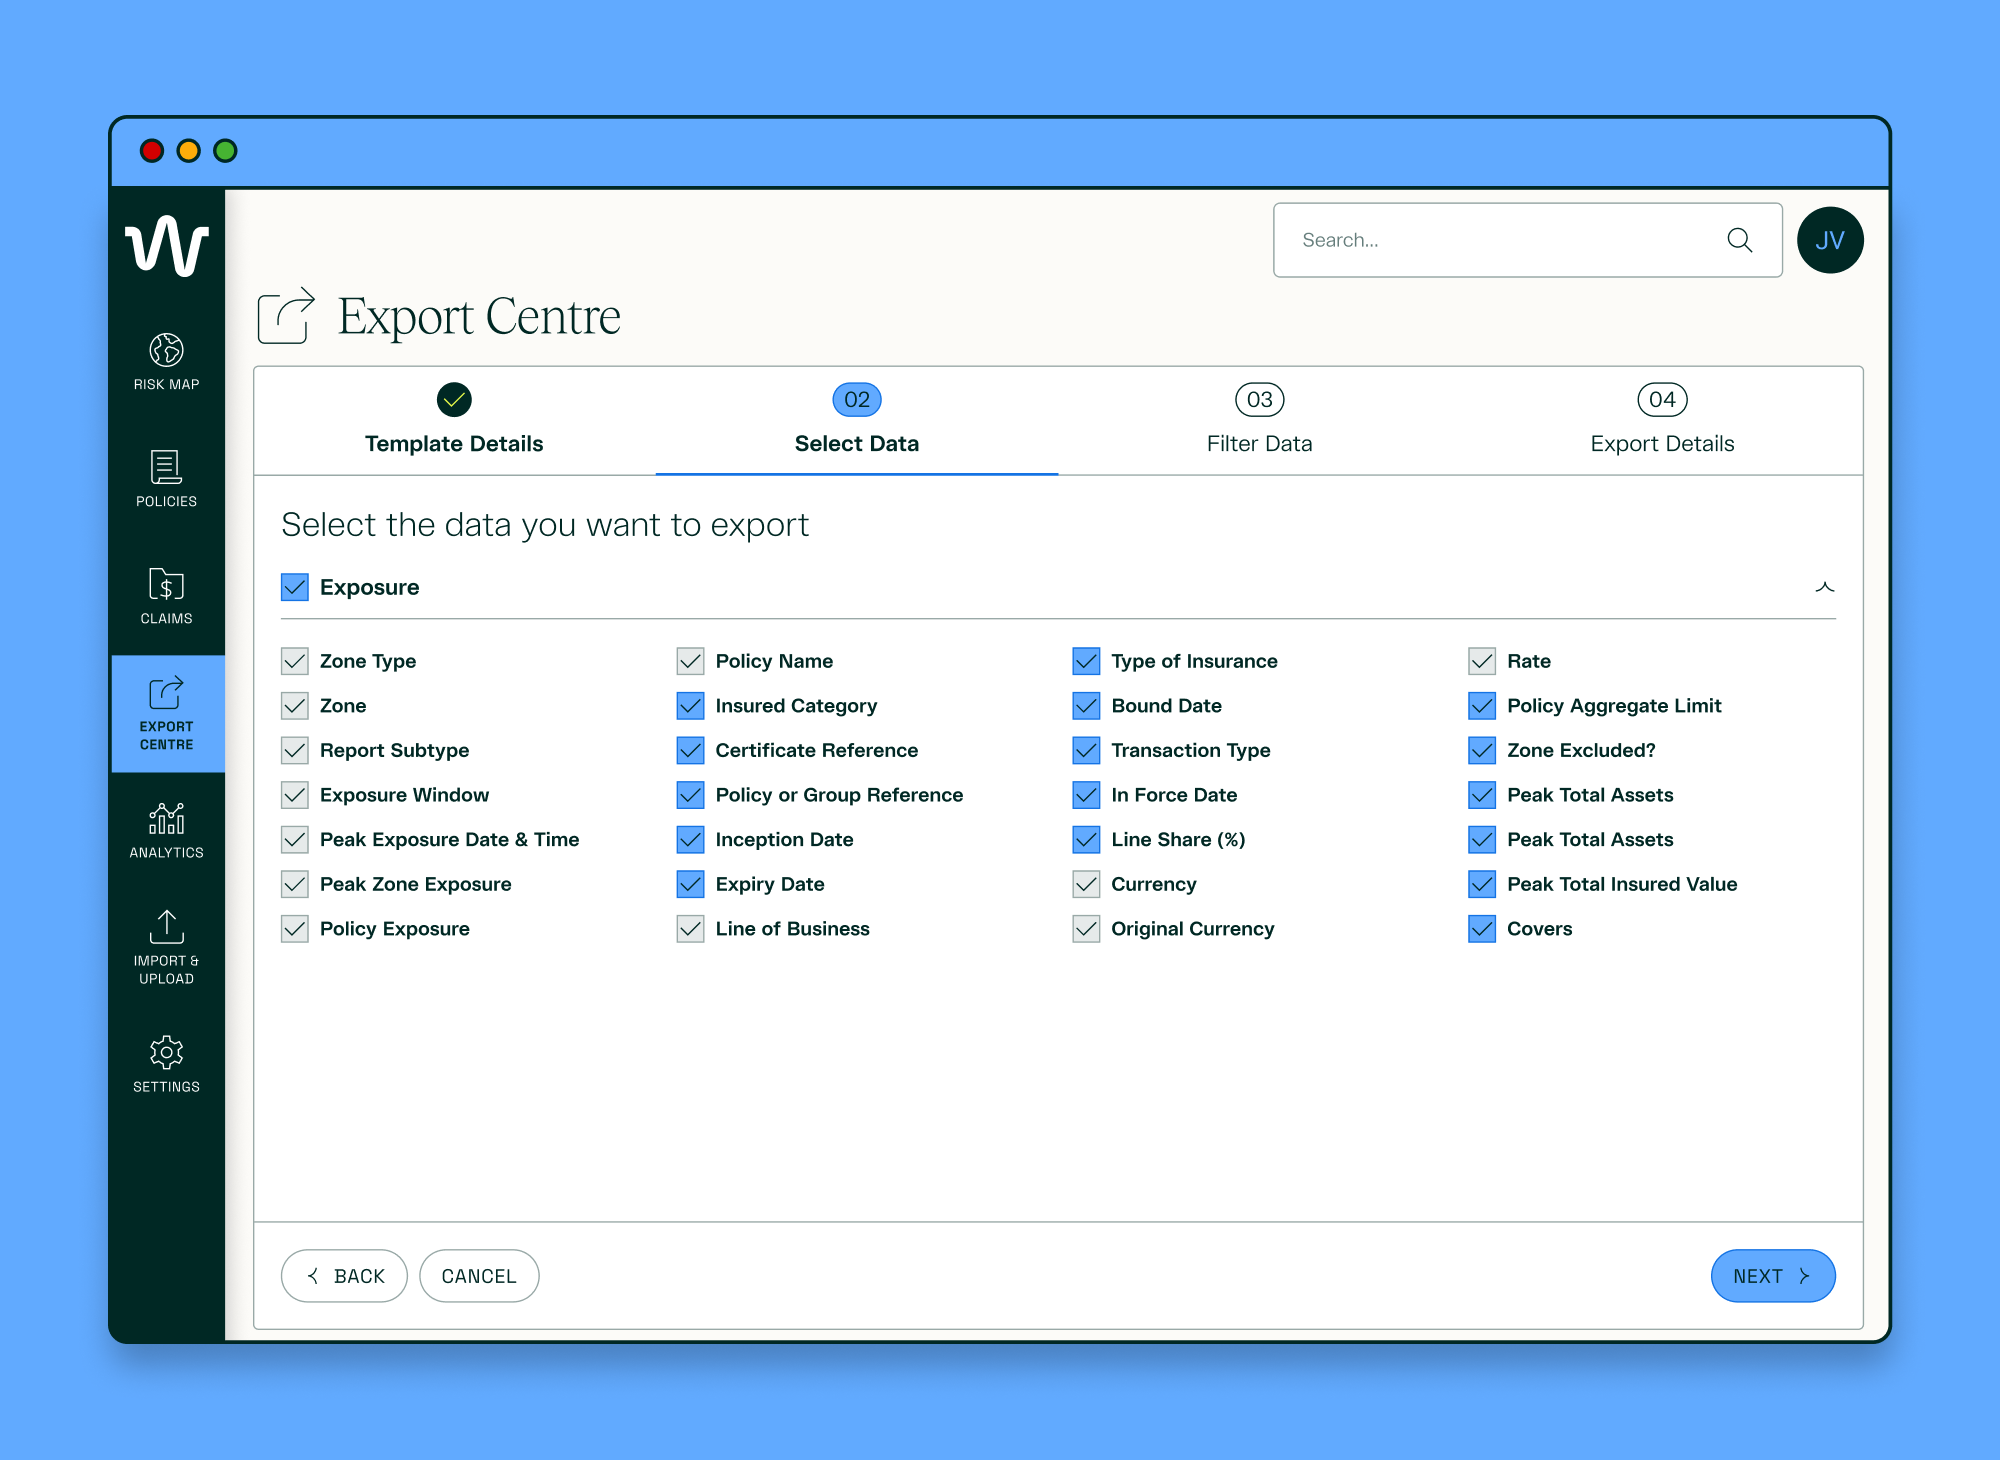
Export Centre - Create Template - Select Data

Export Centre - Create Template - Filter Data
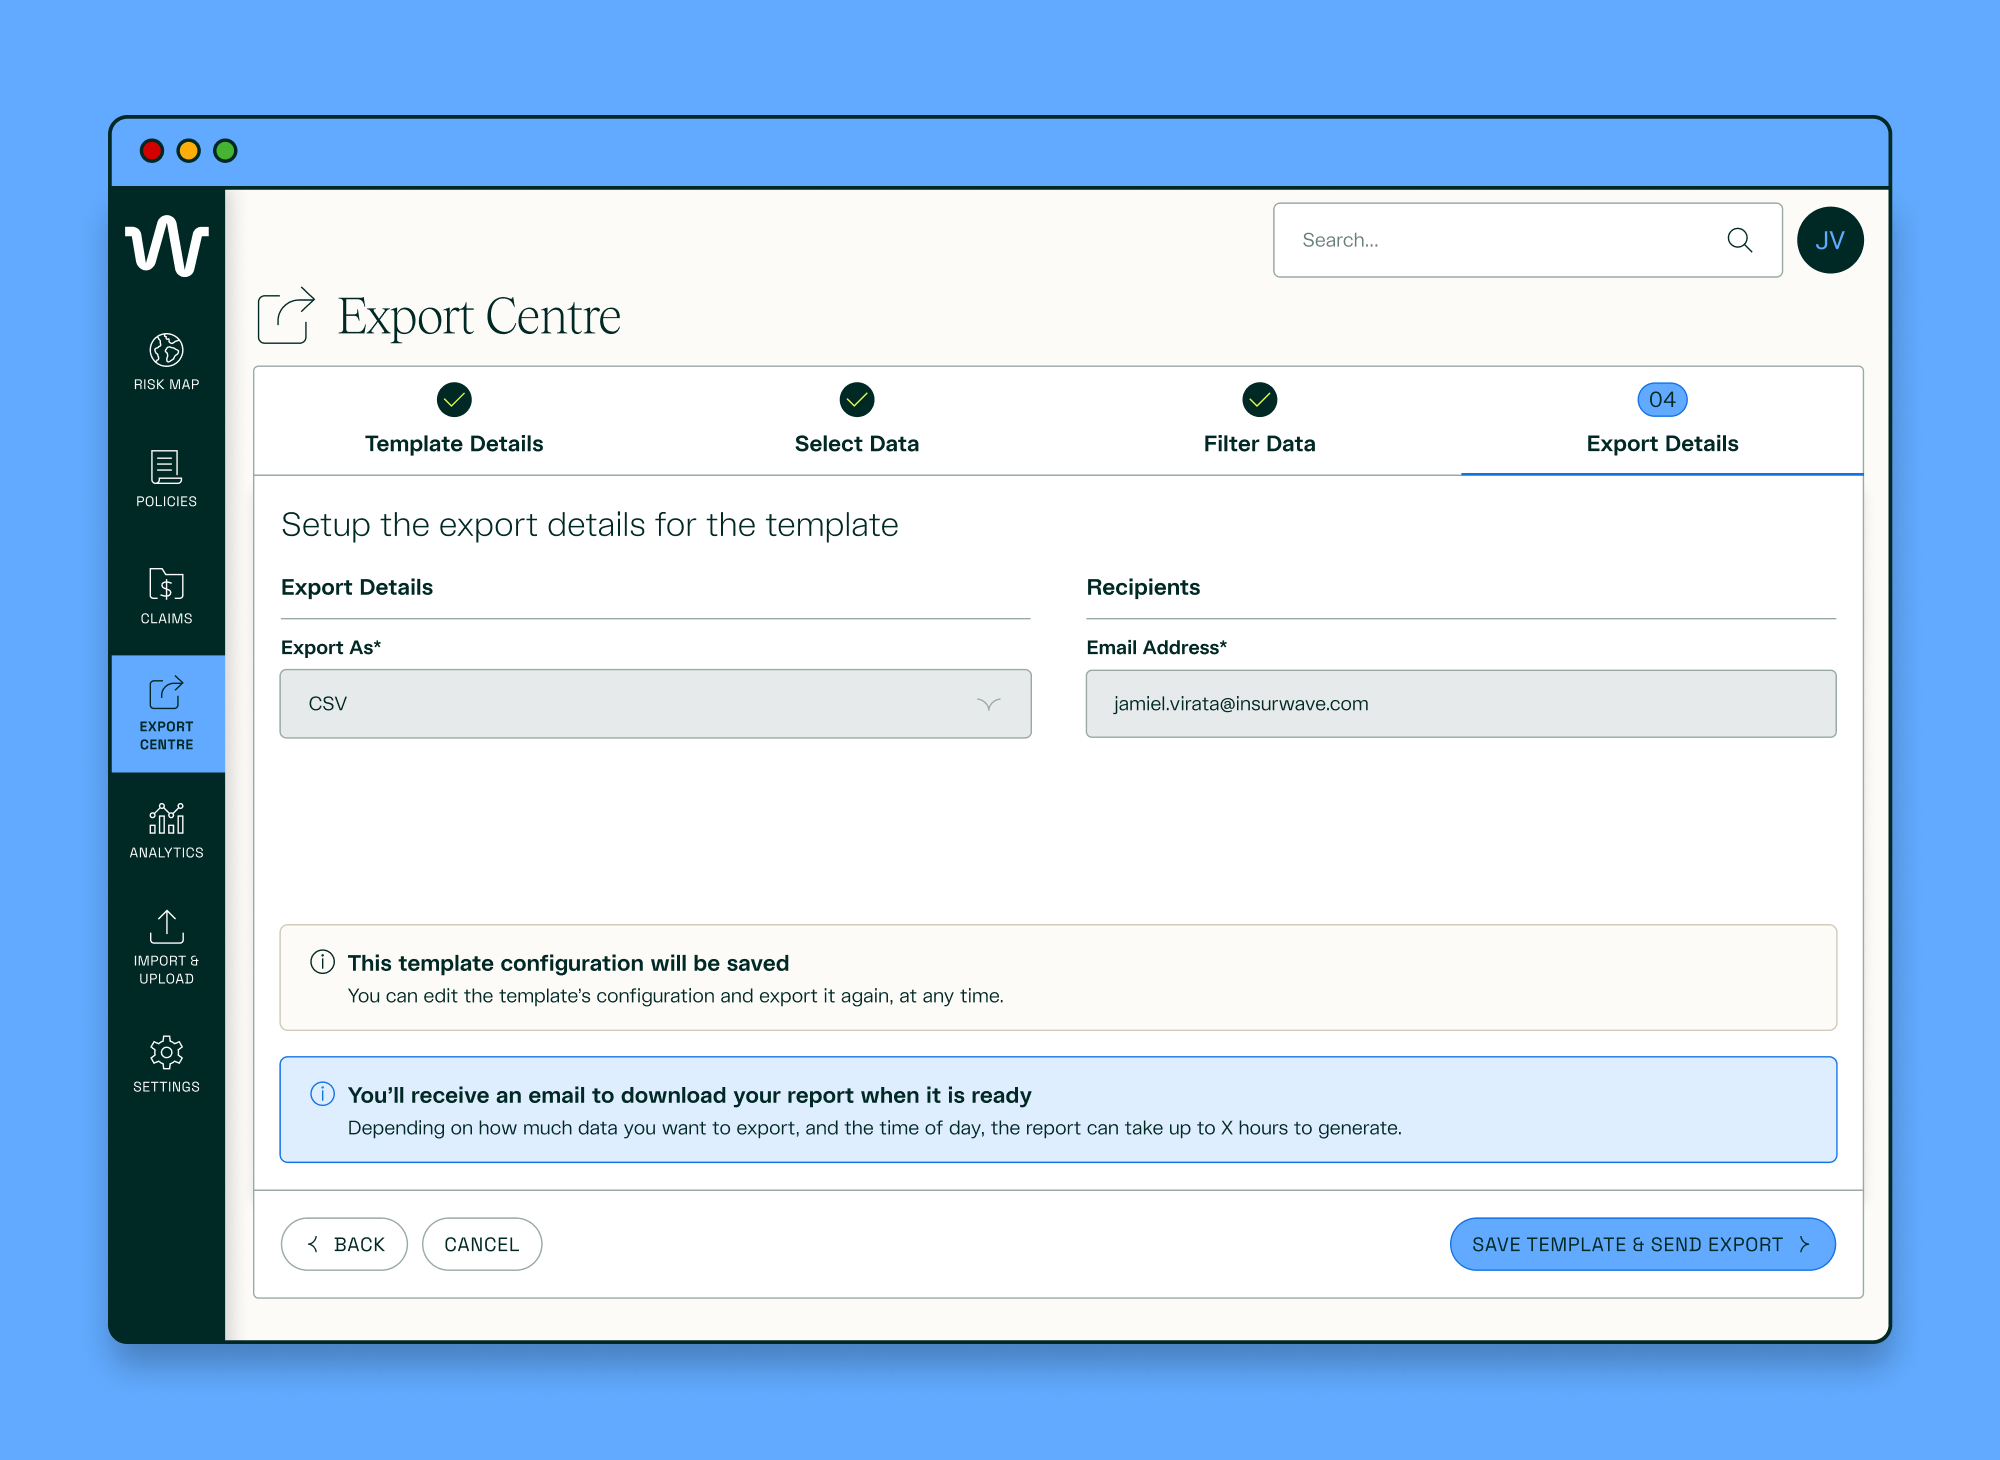
Export Centre - Create Template - Export Details
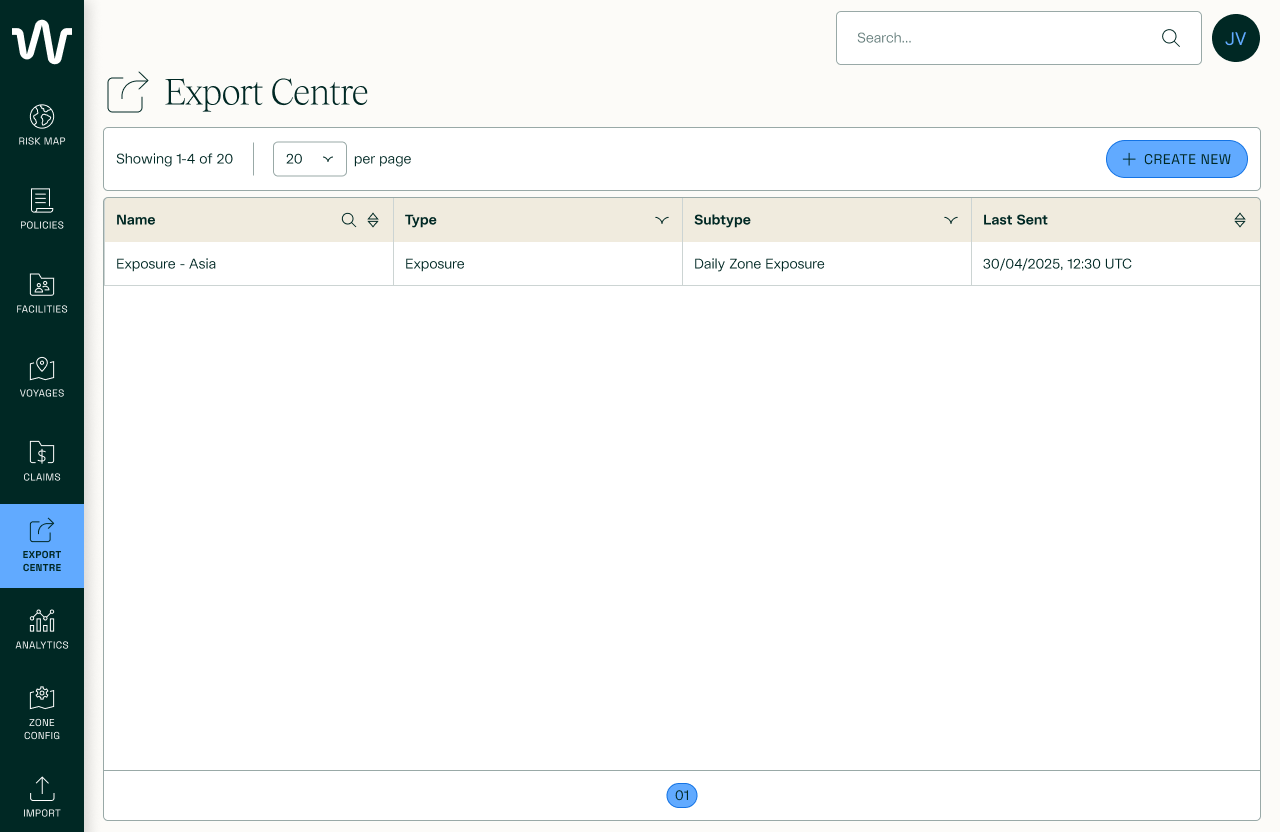
Export Centre - Table
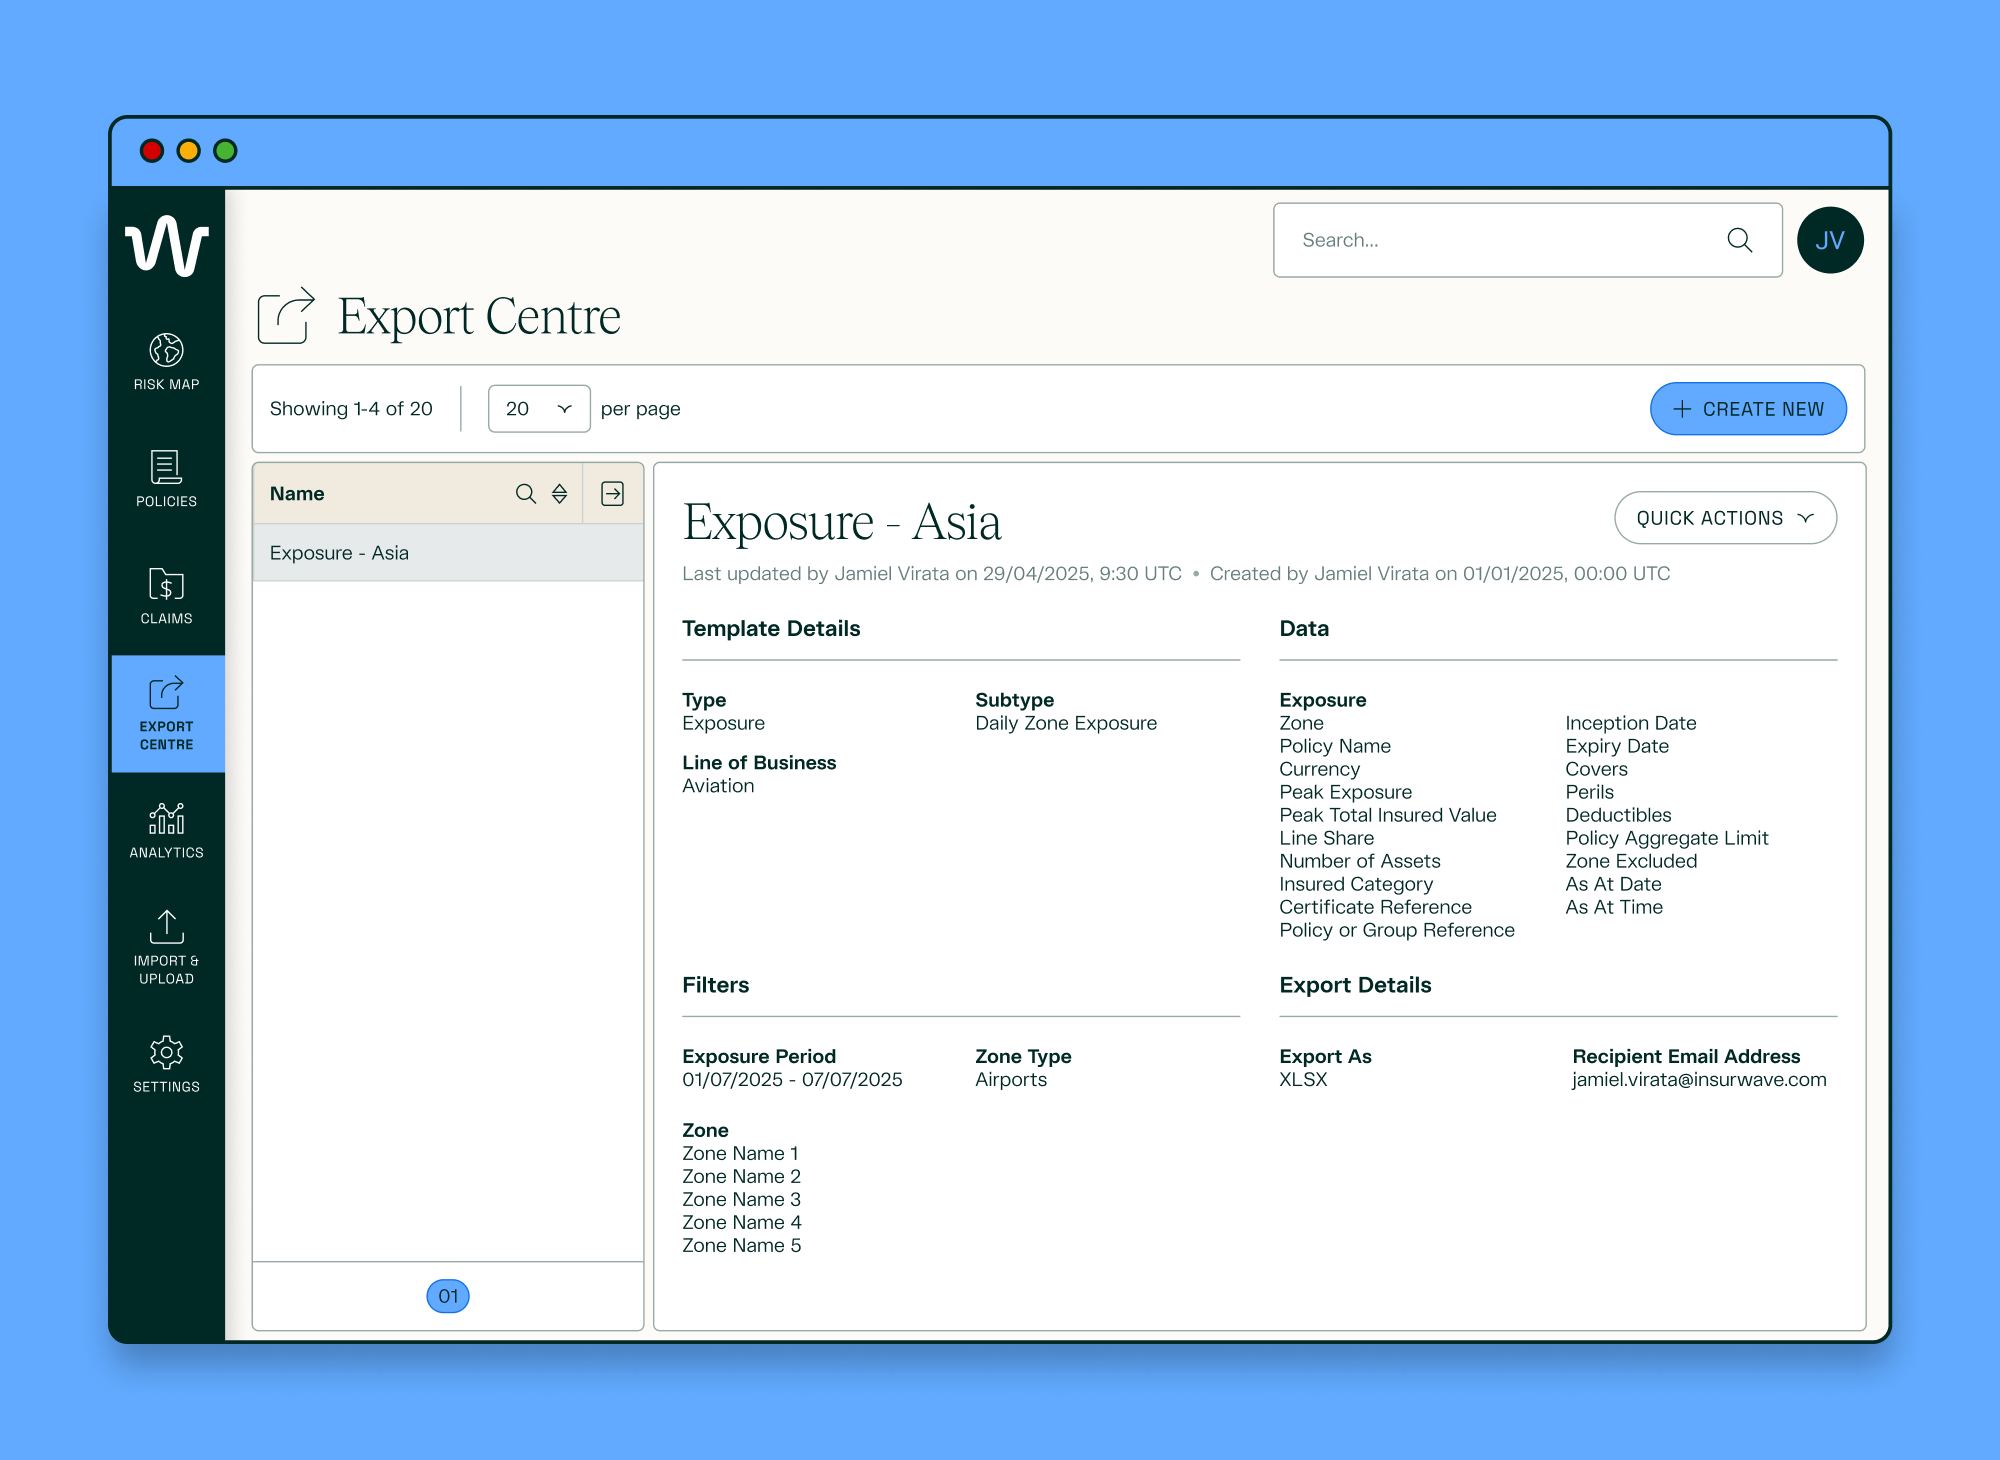
Export Centre - Template Details
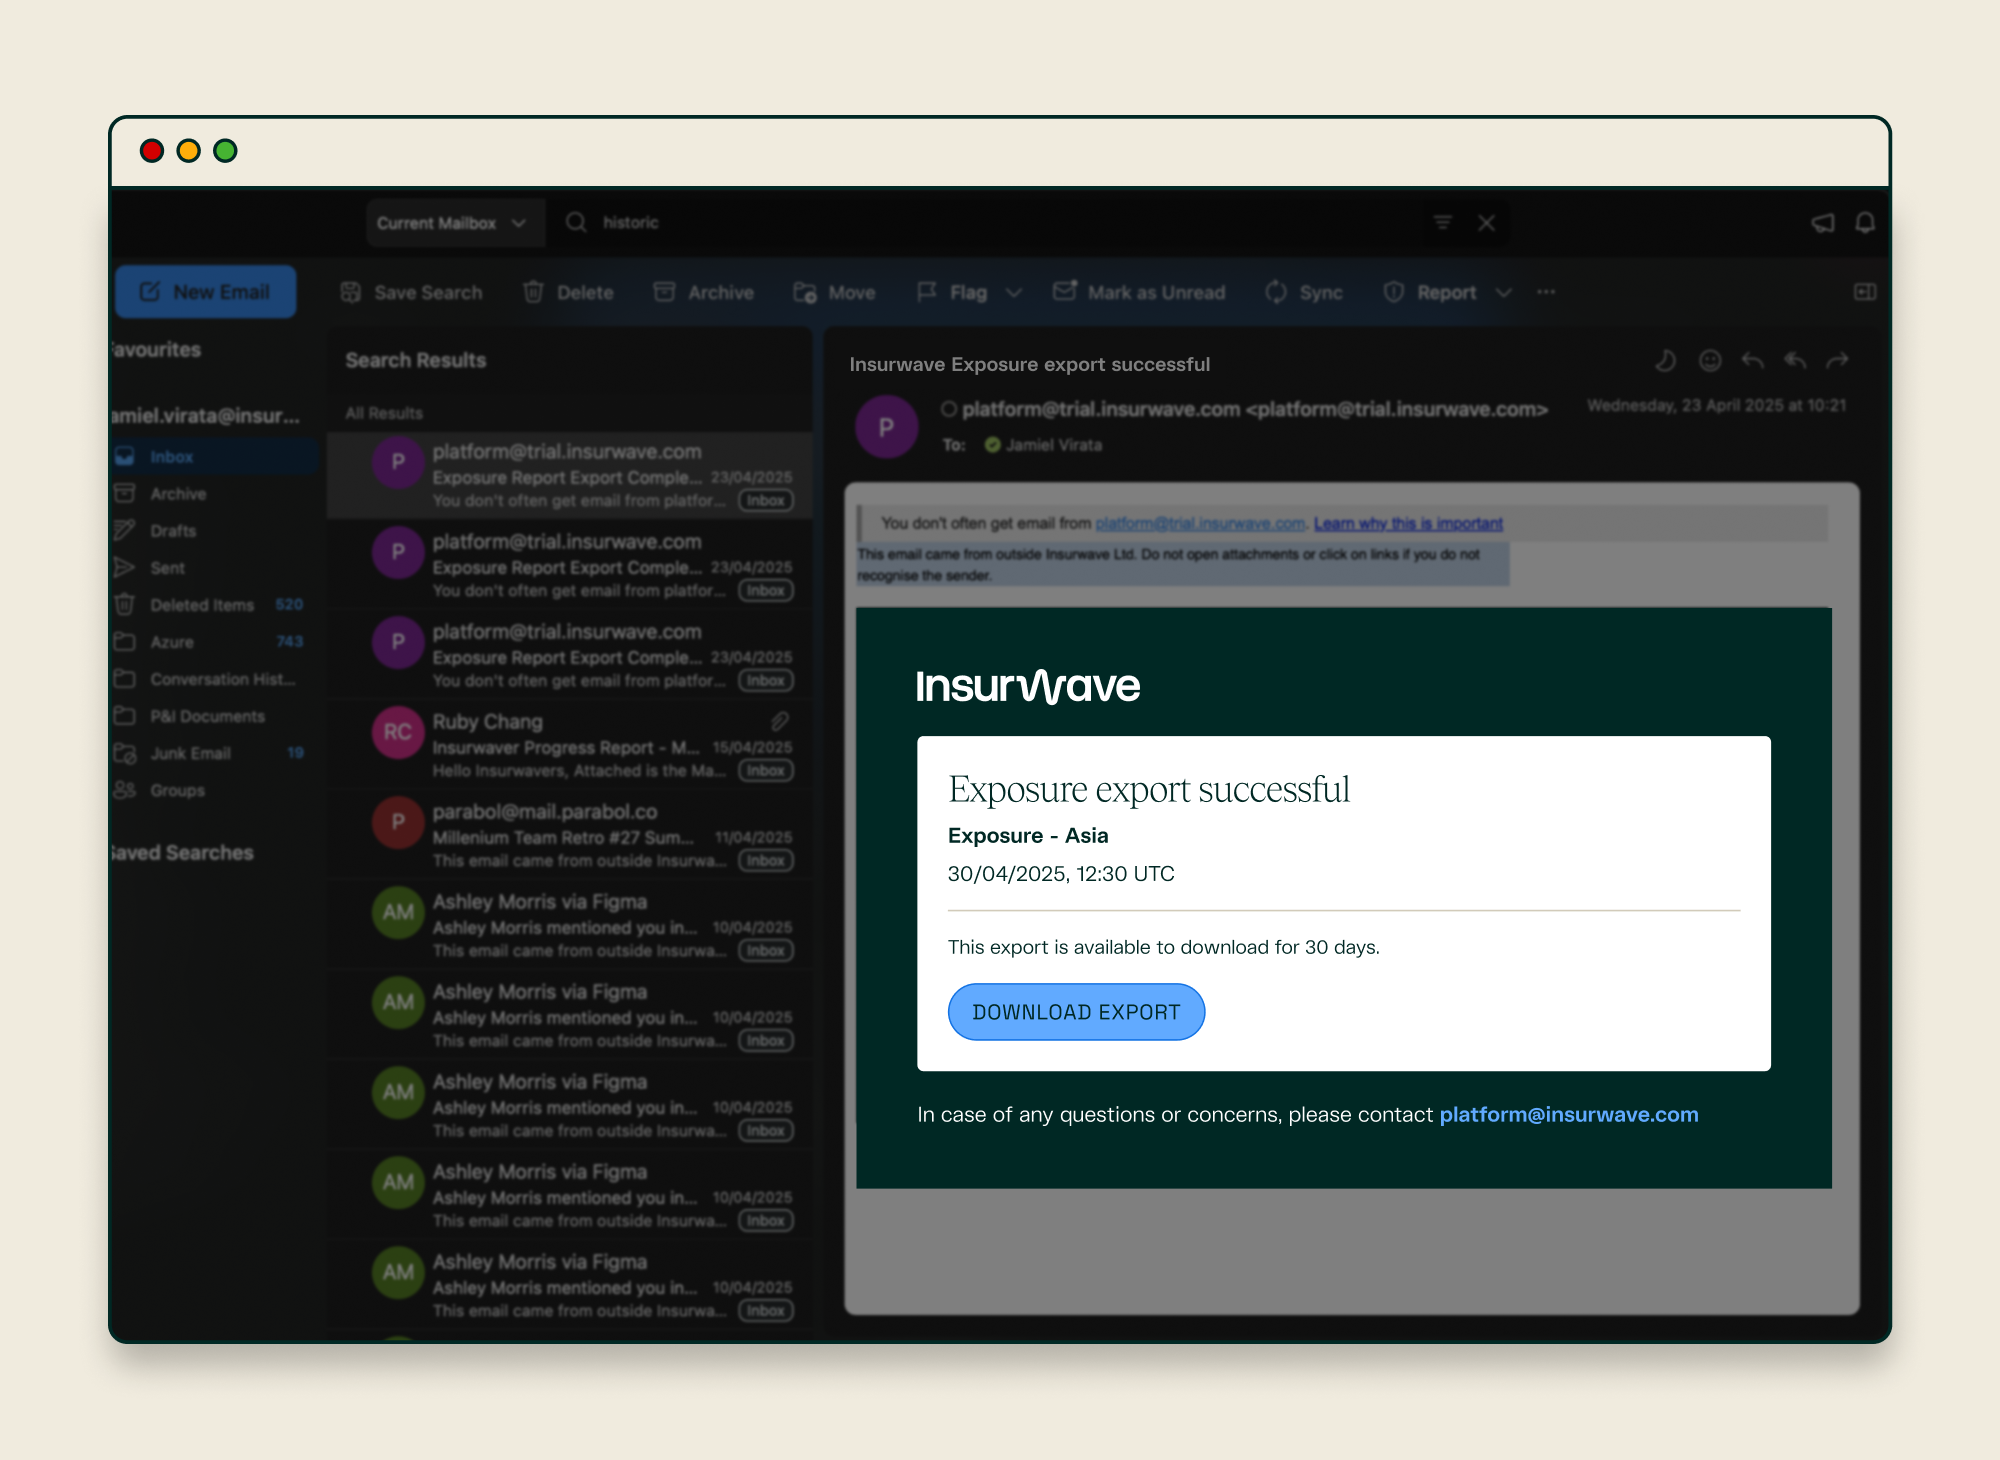
Export Centre - Email - Export Successful
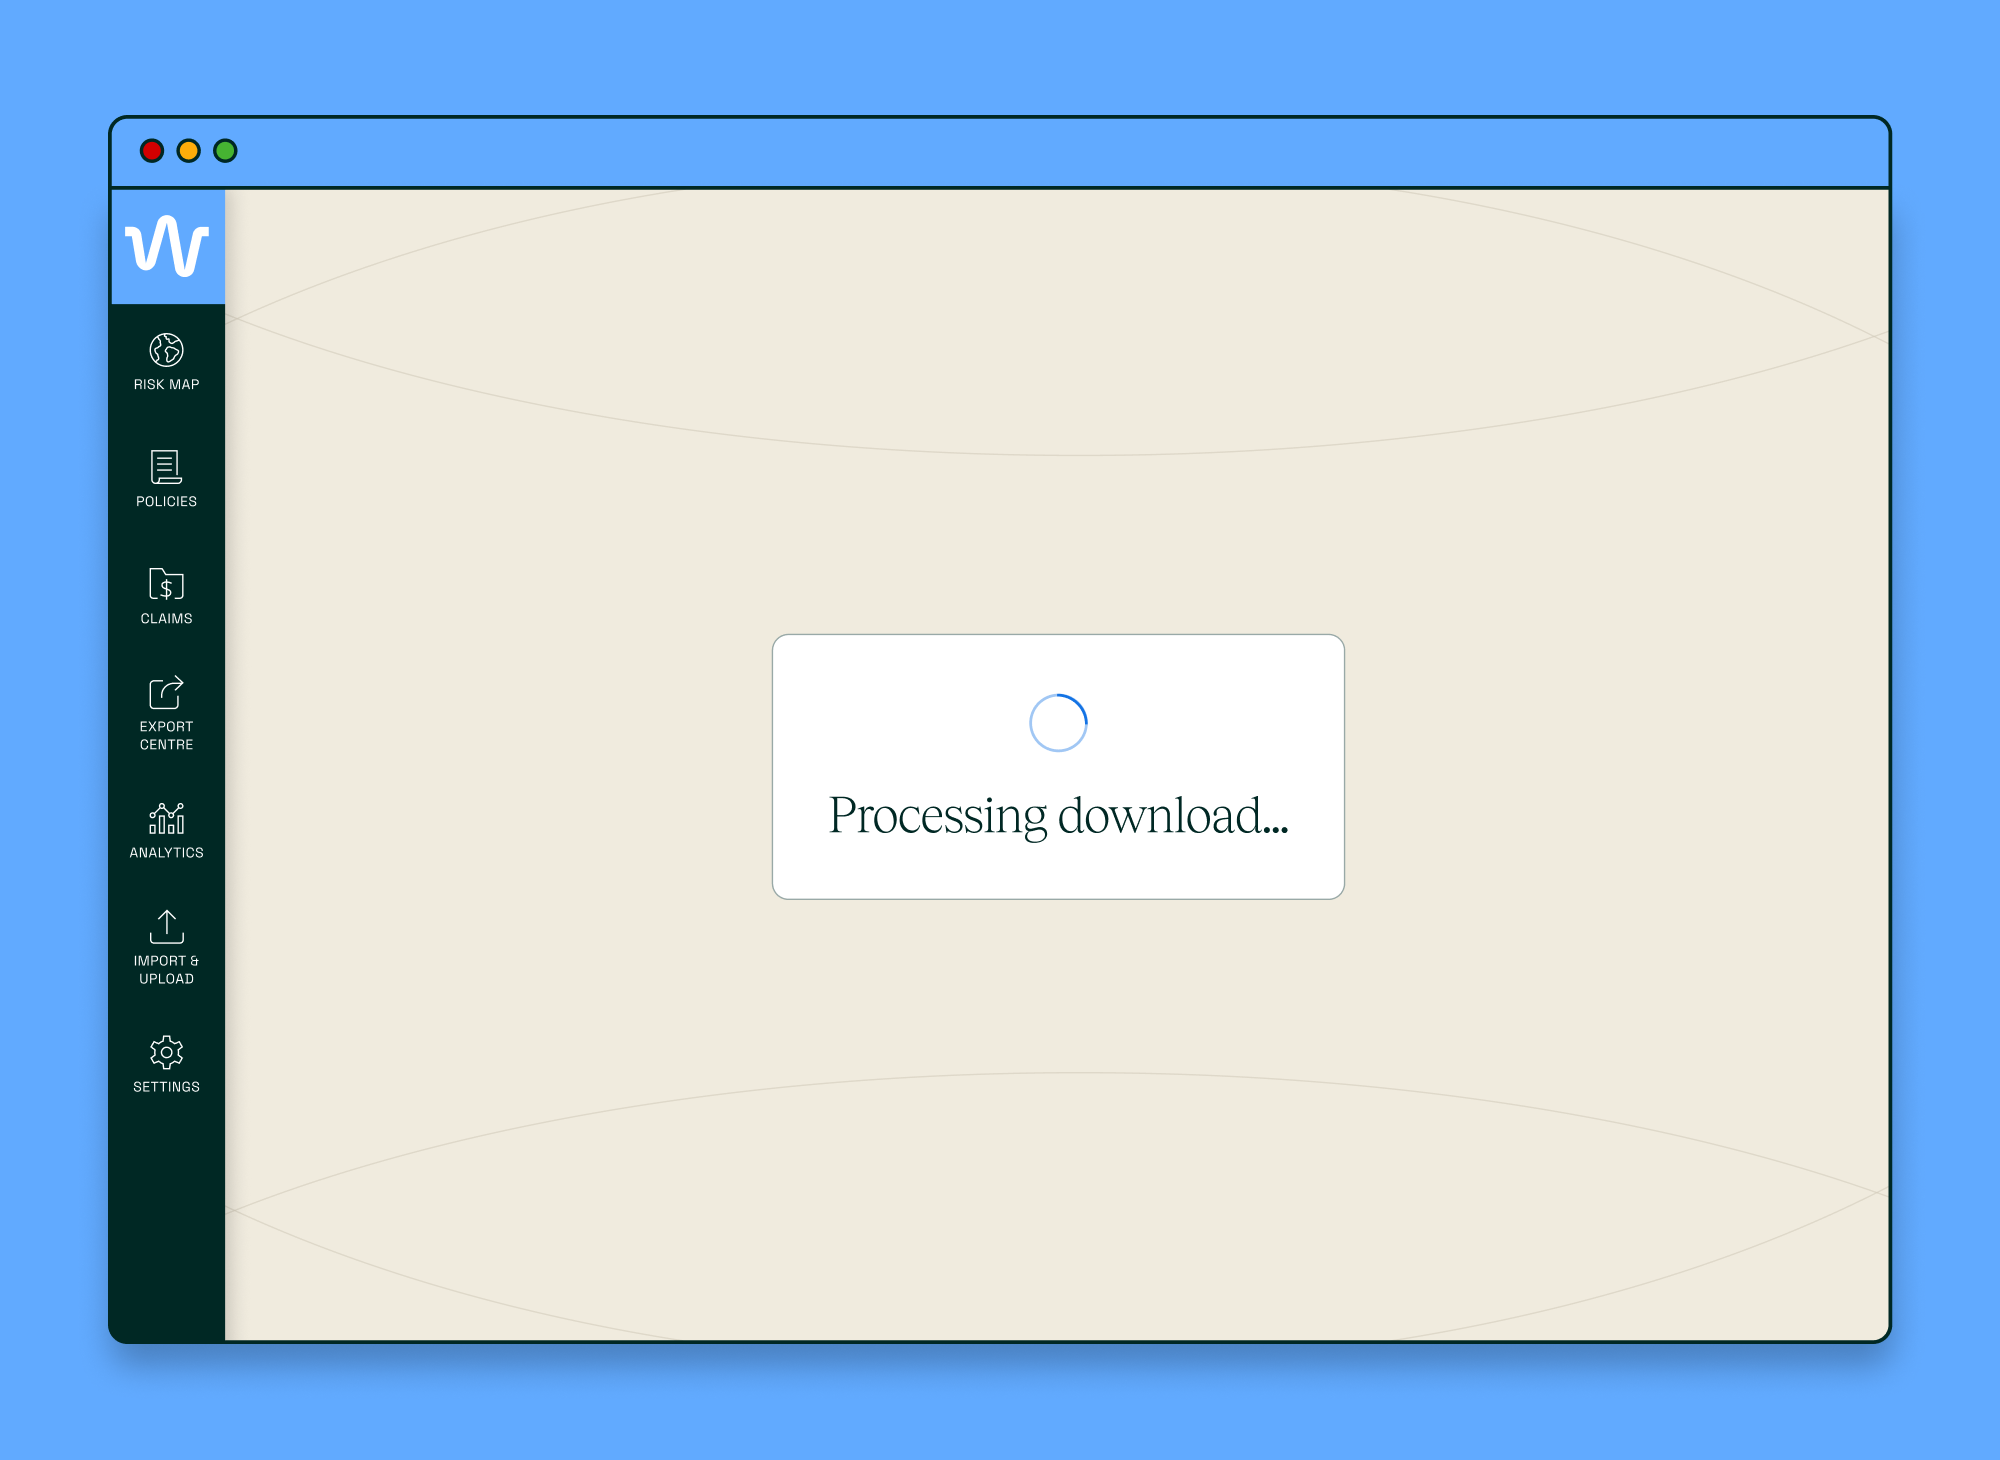
Export Centre - Download
54%
CLIENT ADOPTION
7 out of 13 Aviation Exposure clients have used the feature
108
TOTAL USAGE
Daily Zone Exposure exports
OVERVIEW
Context
After building export capabilities on the Risk Map UI for current & point-in-time exposure, the natural evolution was to create a way for users to export ranges of time for their exposure, so that they could analyse and see trends of their data.
My Role
As the Senior UX/UI Designer, I led the design from Discovery to Build, working closely with Product, Data, and Engineering to create the new Export Centre.
THE PROBLEM
While Insurwave provided a real-time view of asset exposure, there was no capability to analyse historic exposure by policy at a daily or weekly level, which was essential for identifying short-term risk concentrations and operational trends.
This limitation prevented insurers from fully leveraging exposure data to assess past risk, optimise underwriting strategies, and improve portfolio management.
THE opportunity
To address this, Insurwave wanted to enable clients to extract structured exposure data—including calculated true exposure—via a standardised interface. This would allow insurers to report on and interrogate their highest exposure by policy over daily and weekly intervals.
So, how might we create an exporting feature that gave customisation and flexibility to the user, whilst addressing the users needs of extracting exposure data off our platform?
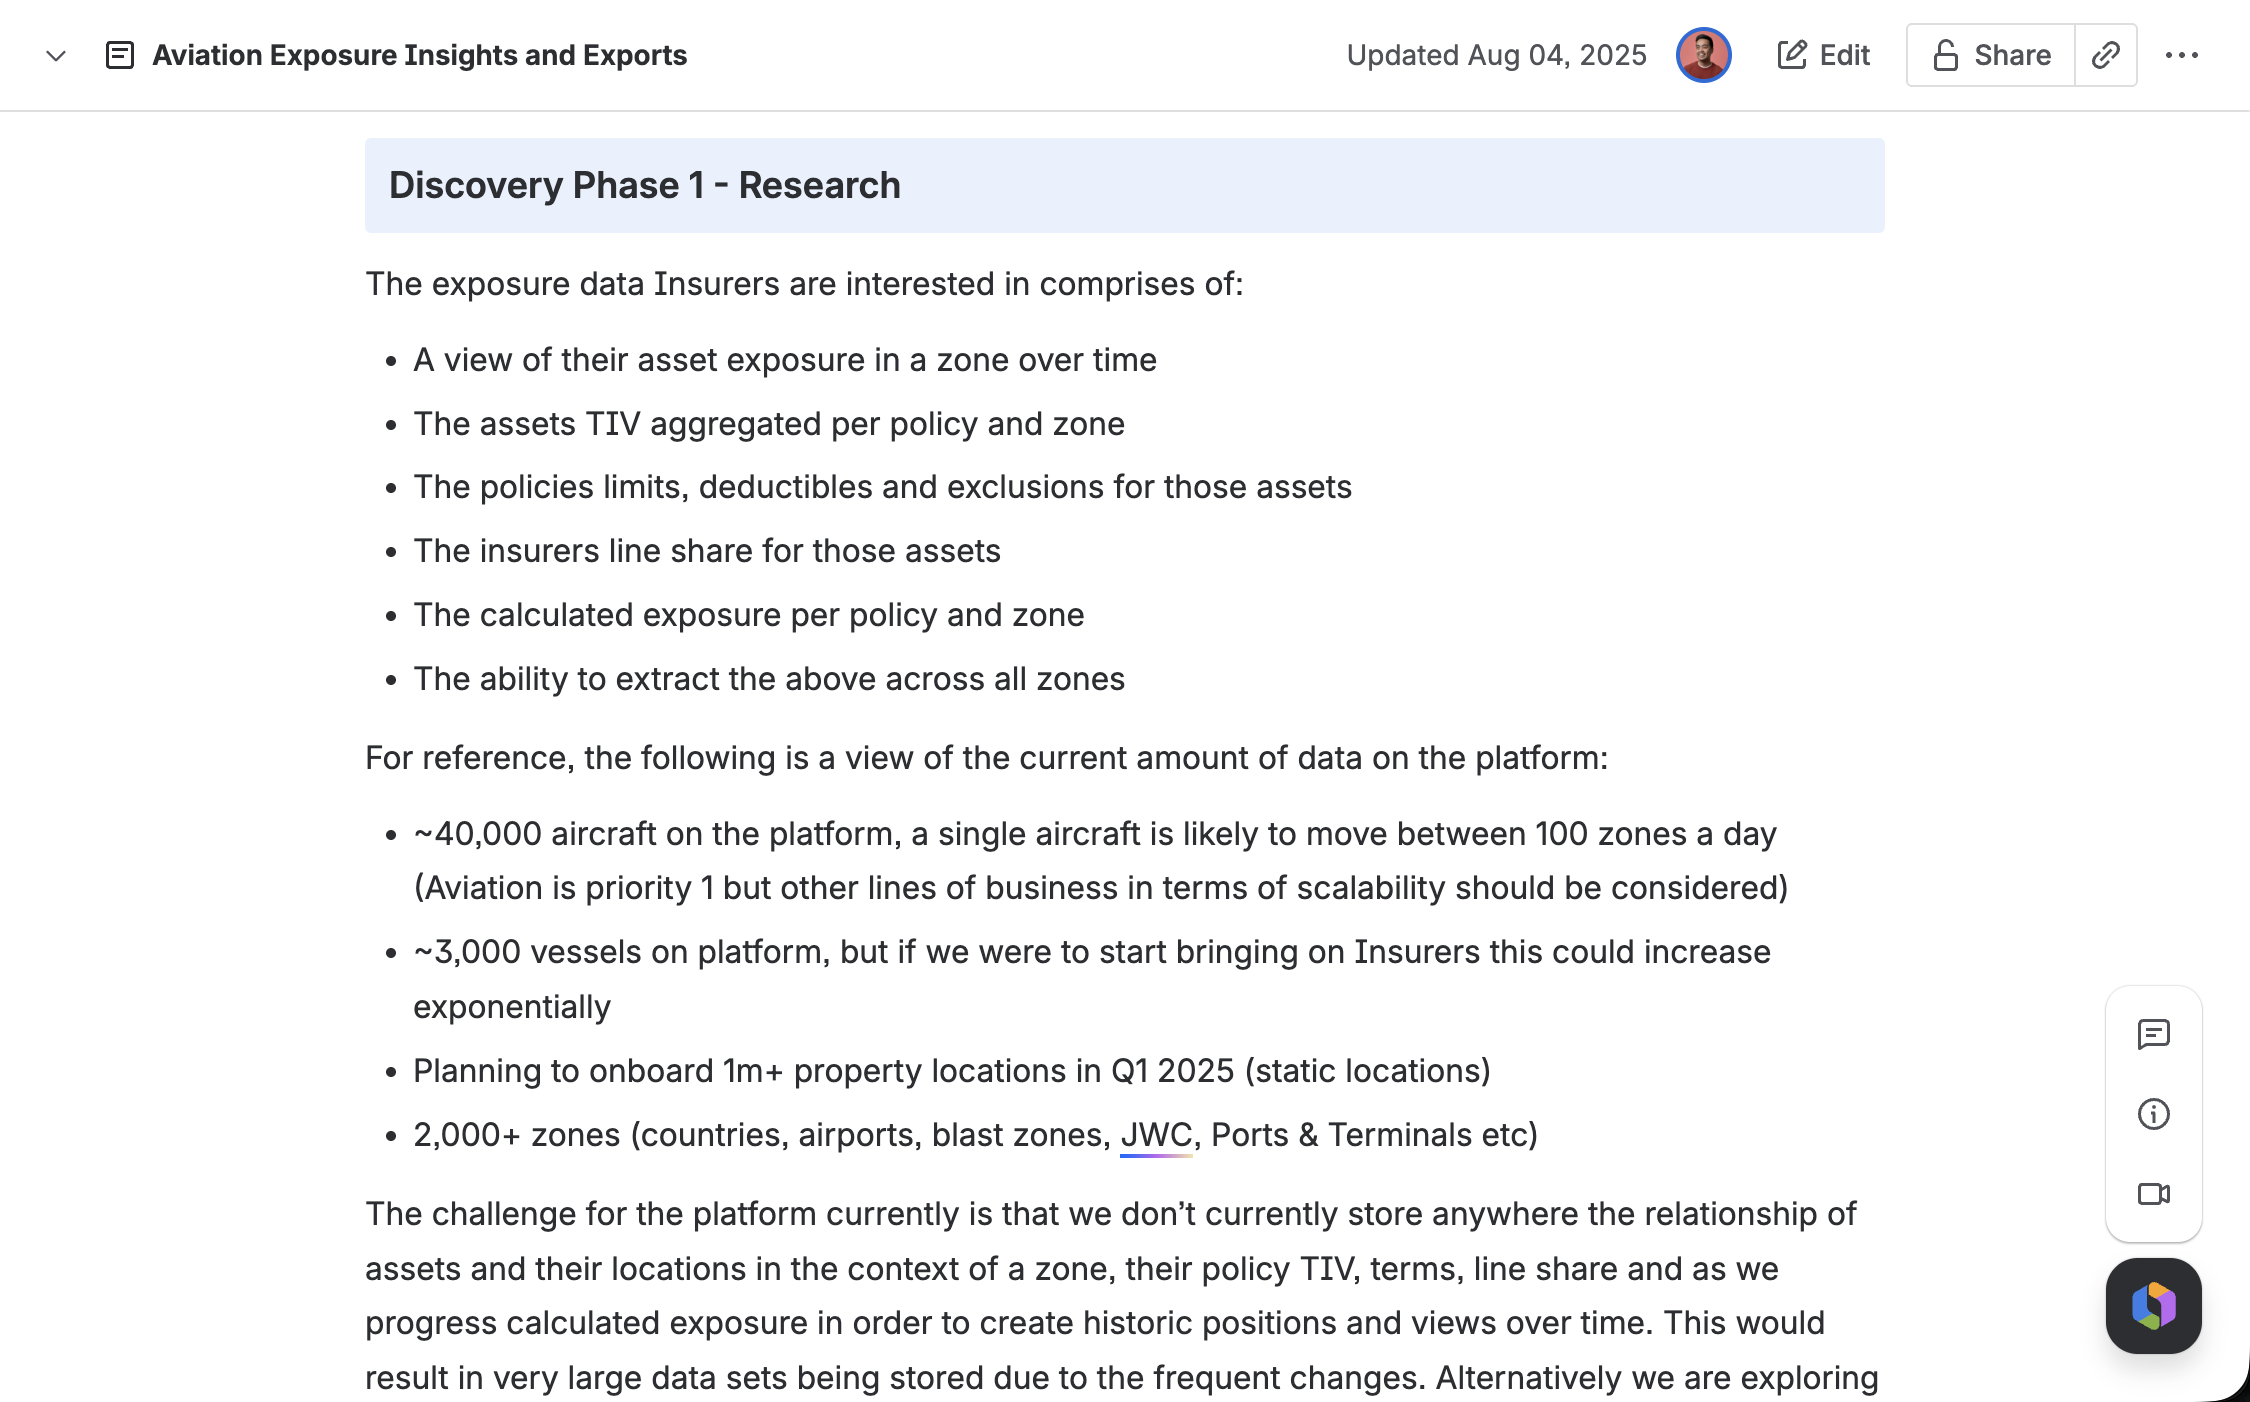
RESEARCH & DISCOVERY
Working closely with Product, we captured user and product requirements to provide further value for our Exposure clients.
We went back to our primary research (surveys and subsequent workshops with clients) to determine what our clients needs were, and each client was at a different stage:
Client A didn’t have any historic Exposure data, so any data and dashboards would be highly beneficial.
Client B and C had their own dashboards using their own data, however both were missing key data points that would be make their data more useful, which Insurwave had.
Client D, E, and F all had existing Exposure dashboards, using external sources of data to power them, so the goal would be that Insurwave would be able to replace these data sources.
user stories
User Story 1
When I need to generate a specific exposure report,
I want to select from a list of Exposure report types
So I can tailor the report output to the appropriate level
User Story 2
When I need to configure the contents of my exposure report,
I want to view a list of available fields for the selected report model and understand which ones are mandatory,
So I can tailor the report output while ensuring required data is included
User Story 3
When I need to tailor my exposure report output,
I want to apply filters such as zone, policy name, peak exposure thresholds, and date range,
So I can ensure the exported data is relevant and scoped to my needs
User Story 4
When I need to export an exposure report
I want the output to be in CSV format
So I can easily open and manipulate the data in Excel or other tools.
technical requirements
As the Data team wanted to architect the Export Centre using a brand new Data Estate to manage the data, there was a lot of discussion with the Engineering team to make sure that services and APIs were clear and which team was responsible for what.
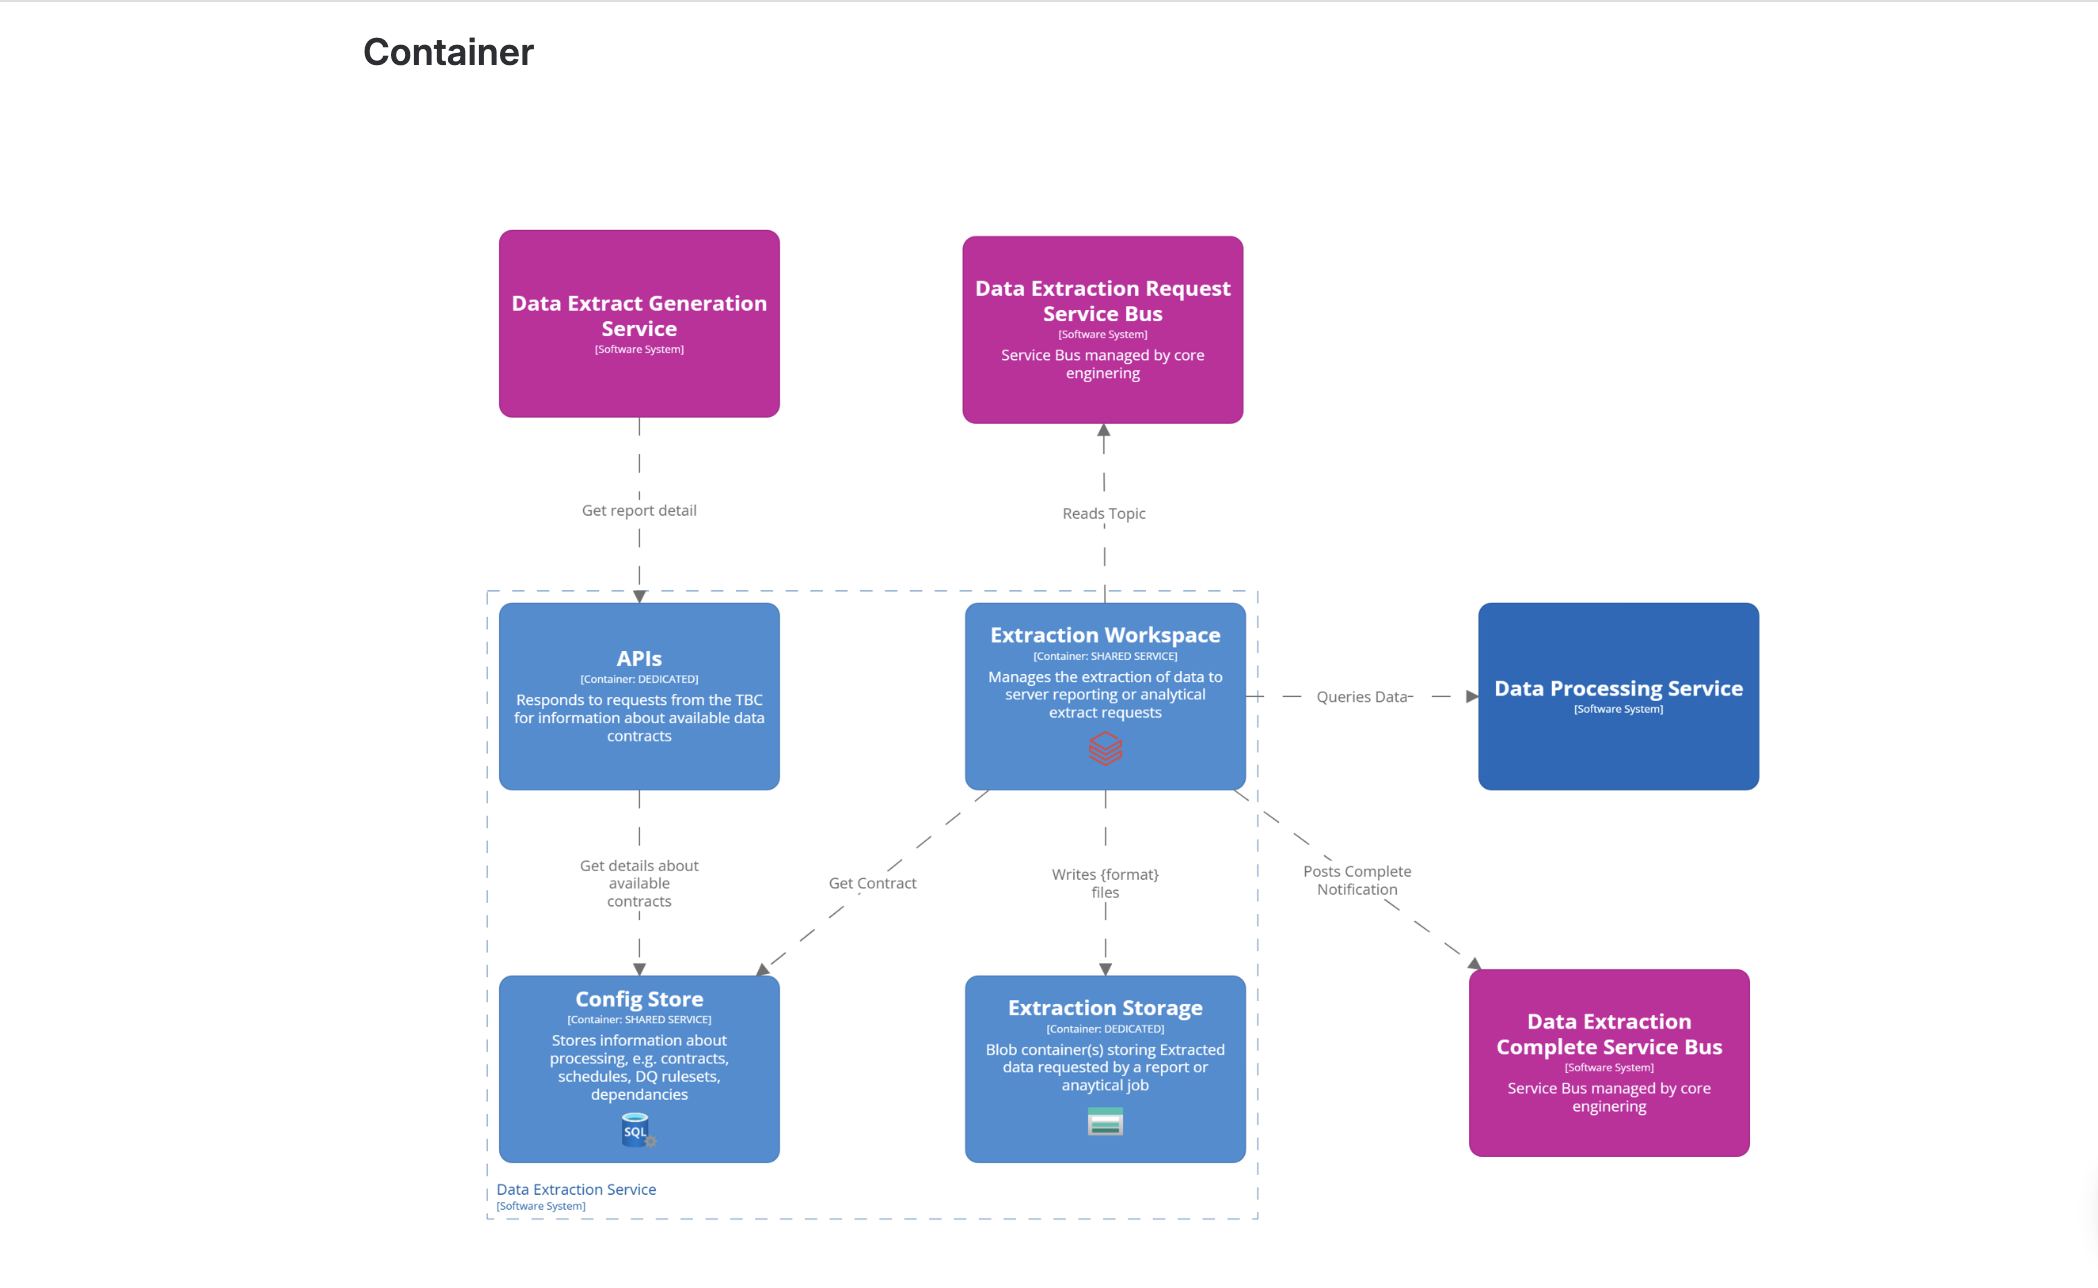
For Design, our main goal was to make sure the UX of the entire flow felt smooth and intuitive, whilst fulfilling the users needs, and that the back-end decisions would not compromise this.
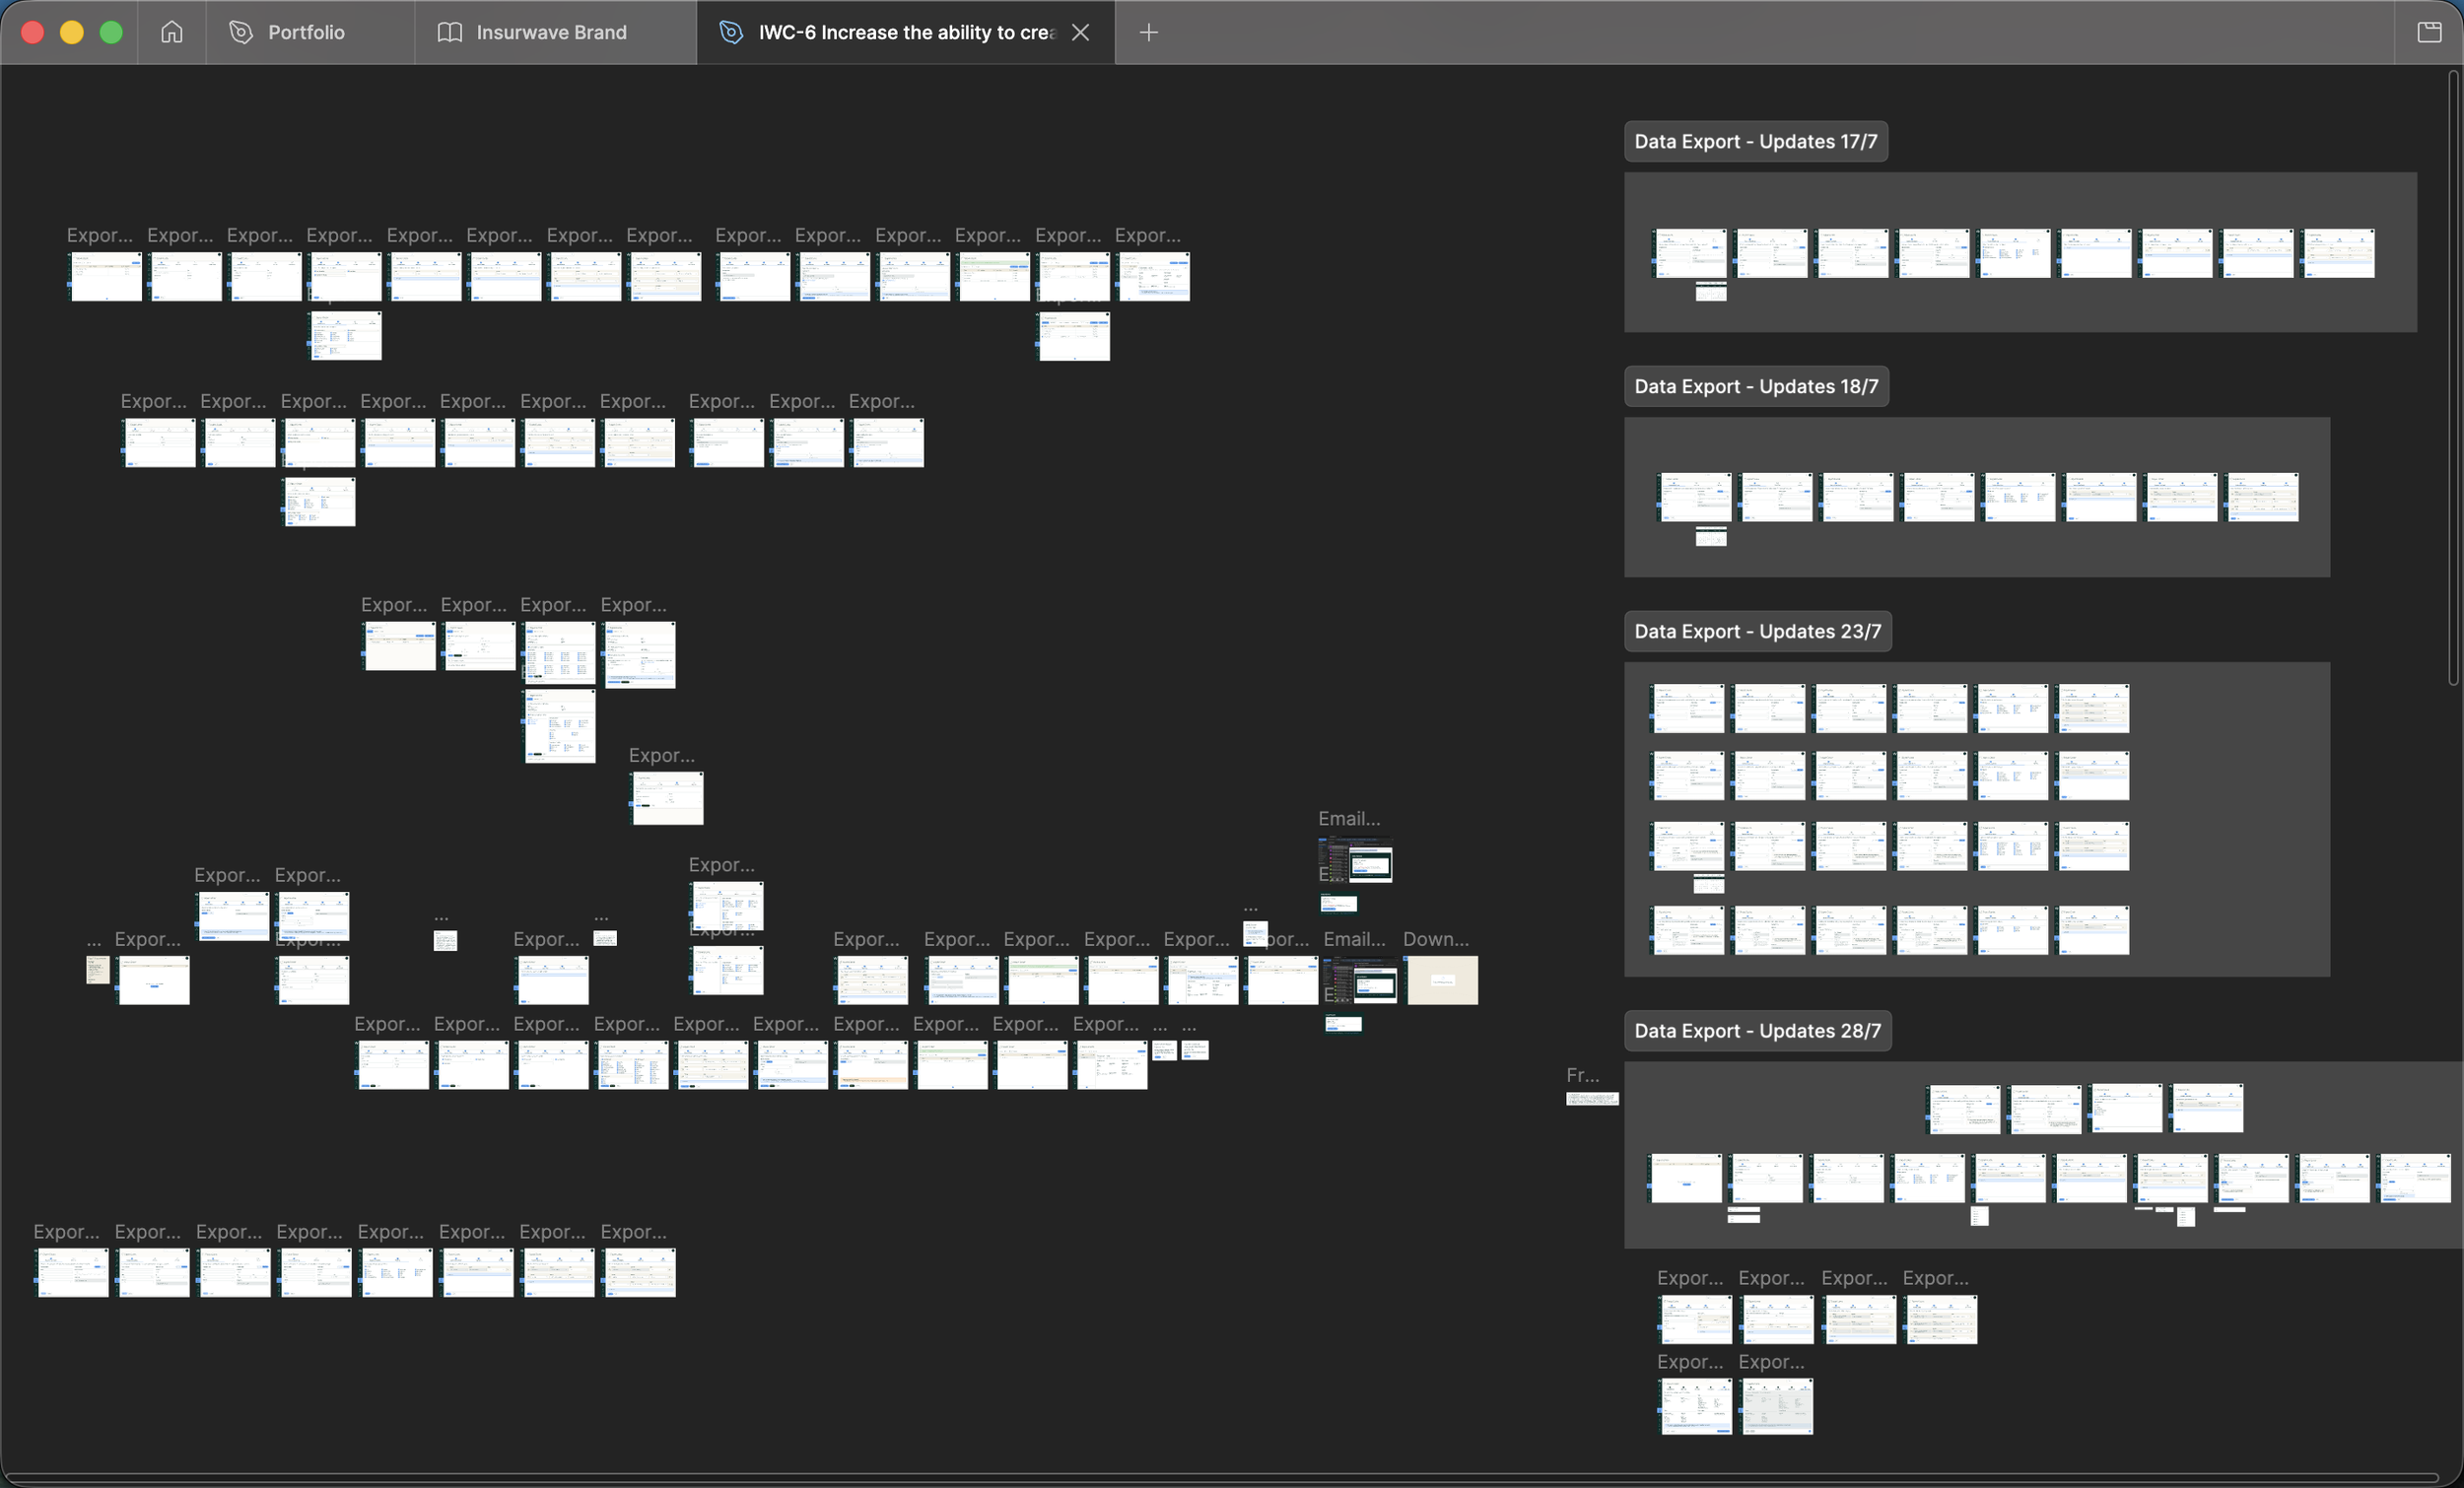
DESIGN process
As this was the first major project that we had using a Data Estate, there were numerous rounds of iterations of the prototype because of technical shifts and decisions, which meant that certain data points needed to be in certain steps of the flow, otherwise it would not work in the back-end.
This became a pressure point in the design process, as initial prototypes grouped certain data points together, as it felt more natural in the flow, but wouldn’t work with how the back-end was set up.
Additionally, there were technical concerns raised - if users could potentially export all historic data, this would severely slow down the service, if many of them did it at the same time, resulting in longer export times and higher costs for the business.
After numerous discussions and compromises, we decided to limit the amount of zone types a user could select, in order to still provide value in the export, but safeguard the newly built service from failing and reduce costs where possible.
LEARNINGS
the importance of requirements
Throughout the Discovery phase, requirements kept changing due to potential additional revenue ideas or technical setup. This diluted the original idea which was to increase the user’s customisation and flexibility of exporting their own data.
I had to set up alignment meetings with key stakeholders during this process as conversations were being made without everyone, leading to confusion and decisions being made on behalf of people.
communication is key
Due to misalignment between key stakeholders, this delayed the progress of the Data Estate being set up and in turn, delayed the entire project.
As the designer on the project, I had to remind everyone what the overall goal was for this feature and to consider everyone’s perspectives, but to keep the user at the centre of everything.
OVERALL RESULTS
OVERALL RESULTS
7 out of 13 (54%) Aviation Exposure clients have used the Export Centre feature post-release.
CLIENTS
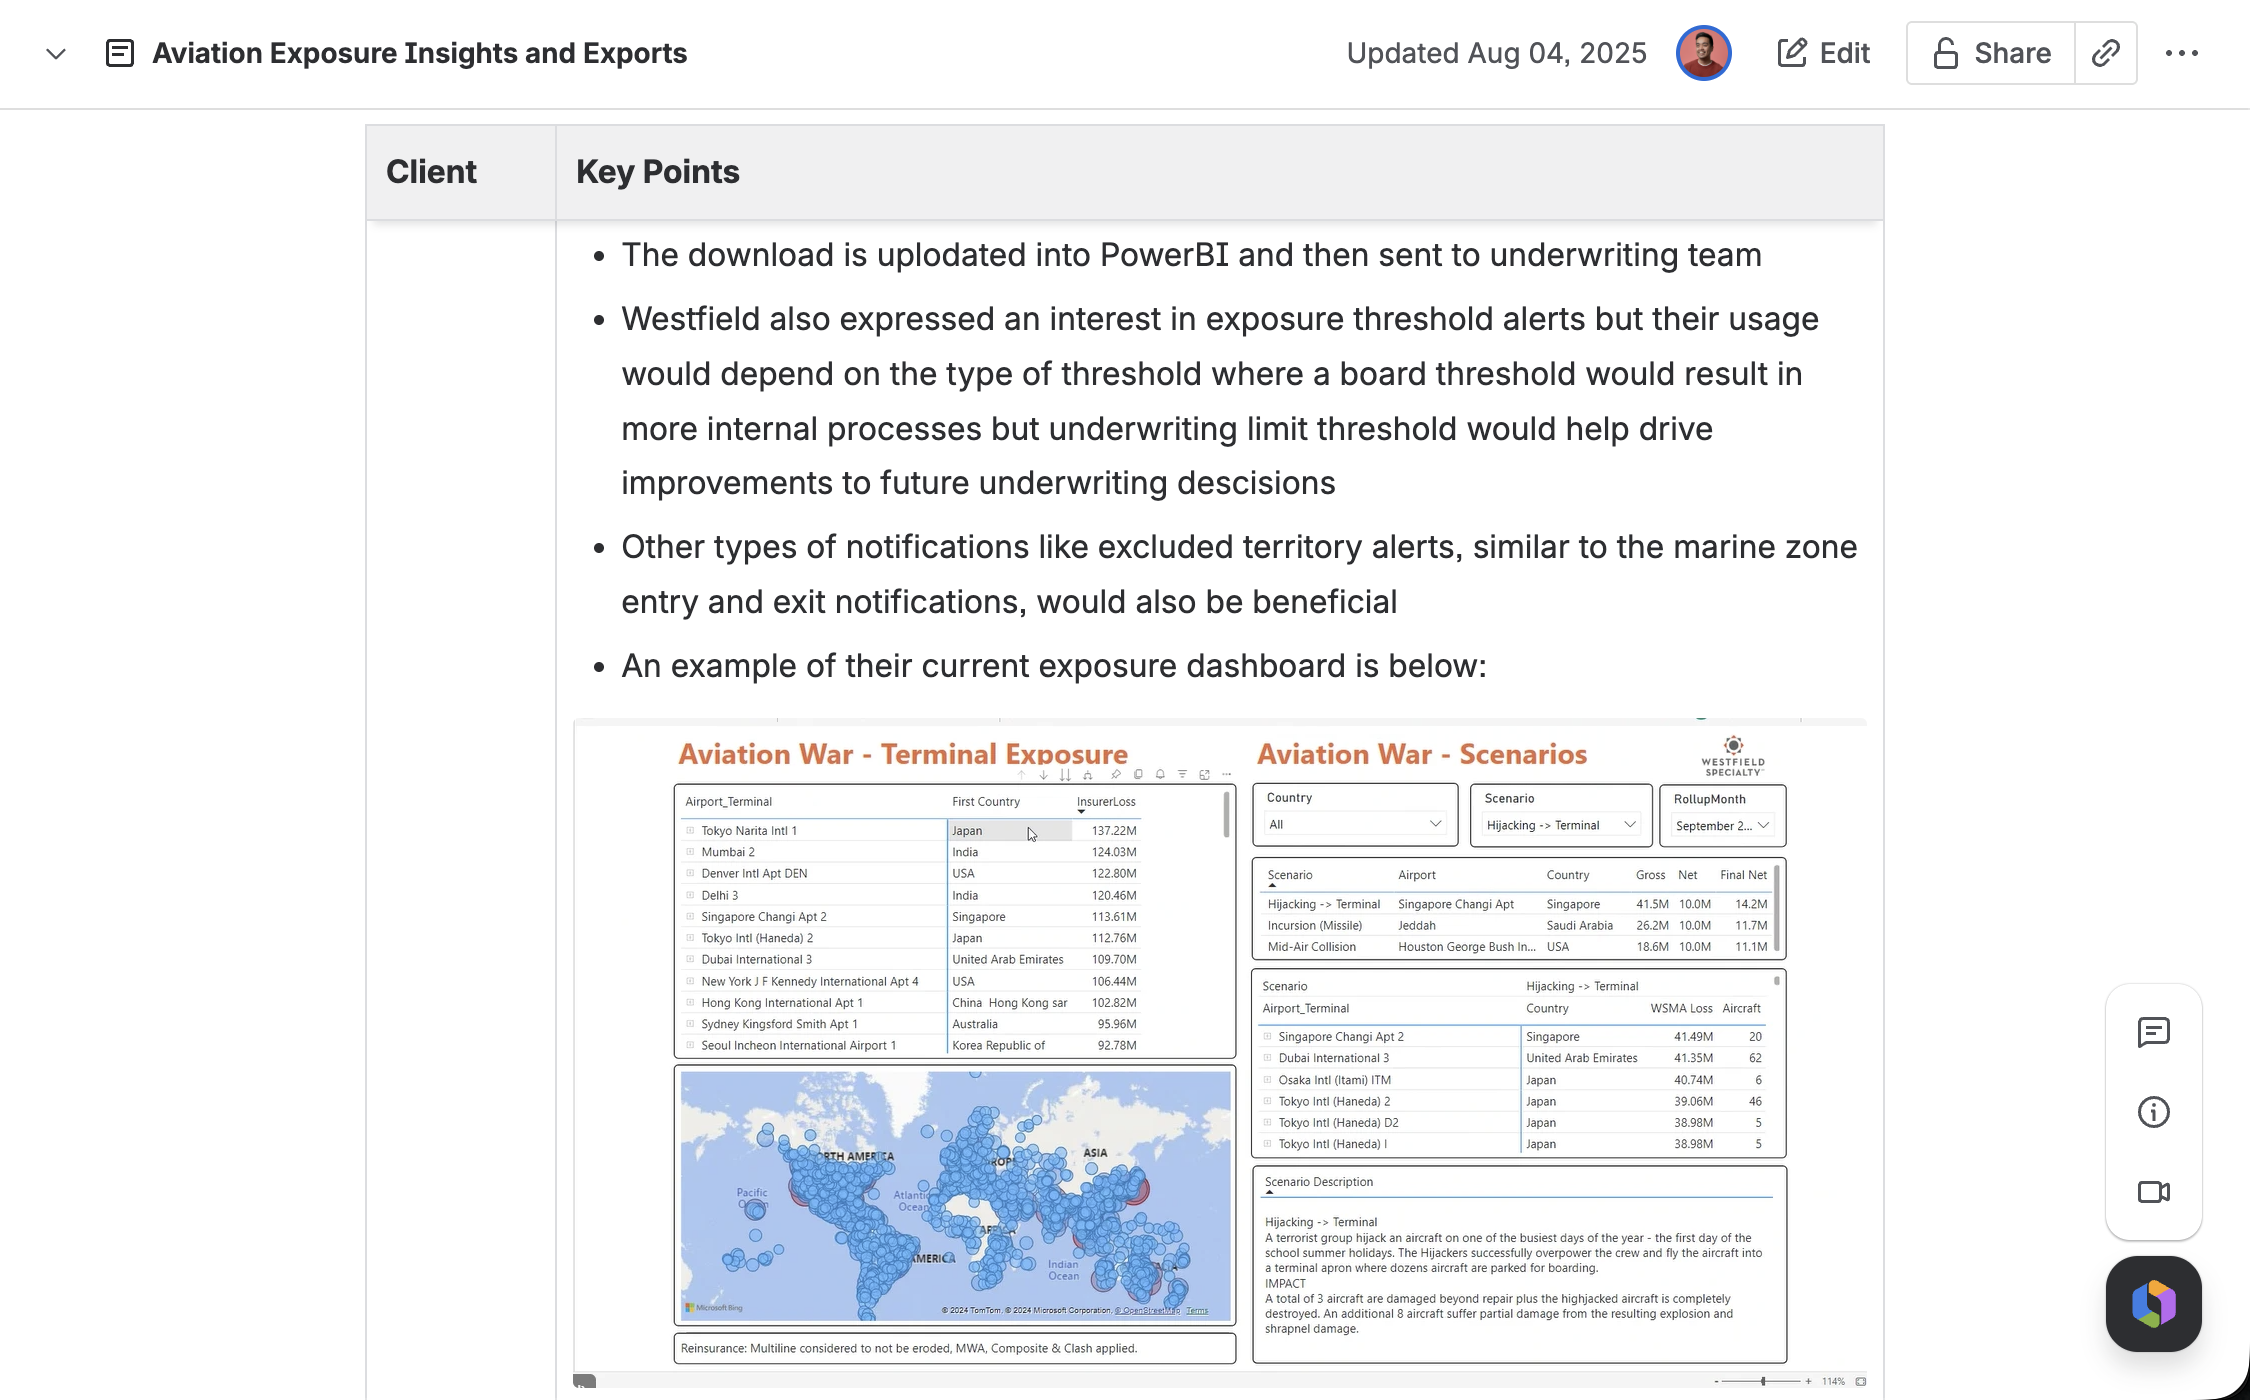
We have seen our clients usage spike during world events, e.g. the conflict in Iran and Lebanon, and are using the feature in reaction to these events. This has provided so much value to our clients, to keep up-to-date exposure calculations as events continue.
There has be 108 exports this year, with most being made between April and May 2026.