Evolving the INSURWAVE EXPOSURE product
Role
Senior UX/UI Designer
Timeline
Jan - Dec 2025
Team
1 PM, 1 PO, 1 Designer, 4 engineers
Platform
Web App
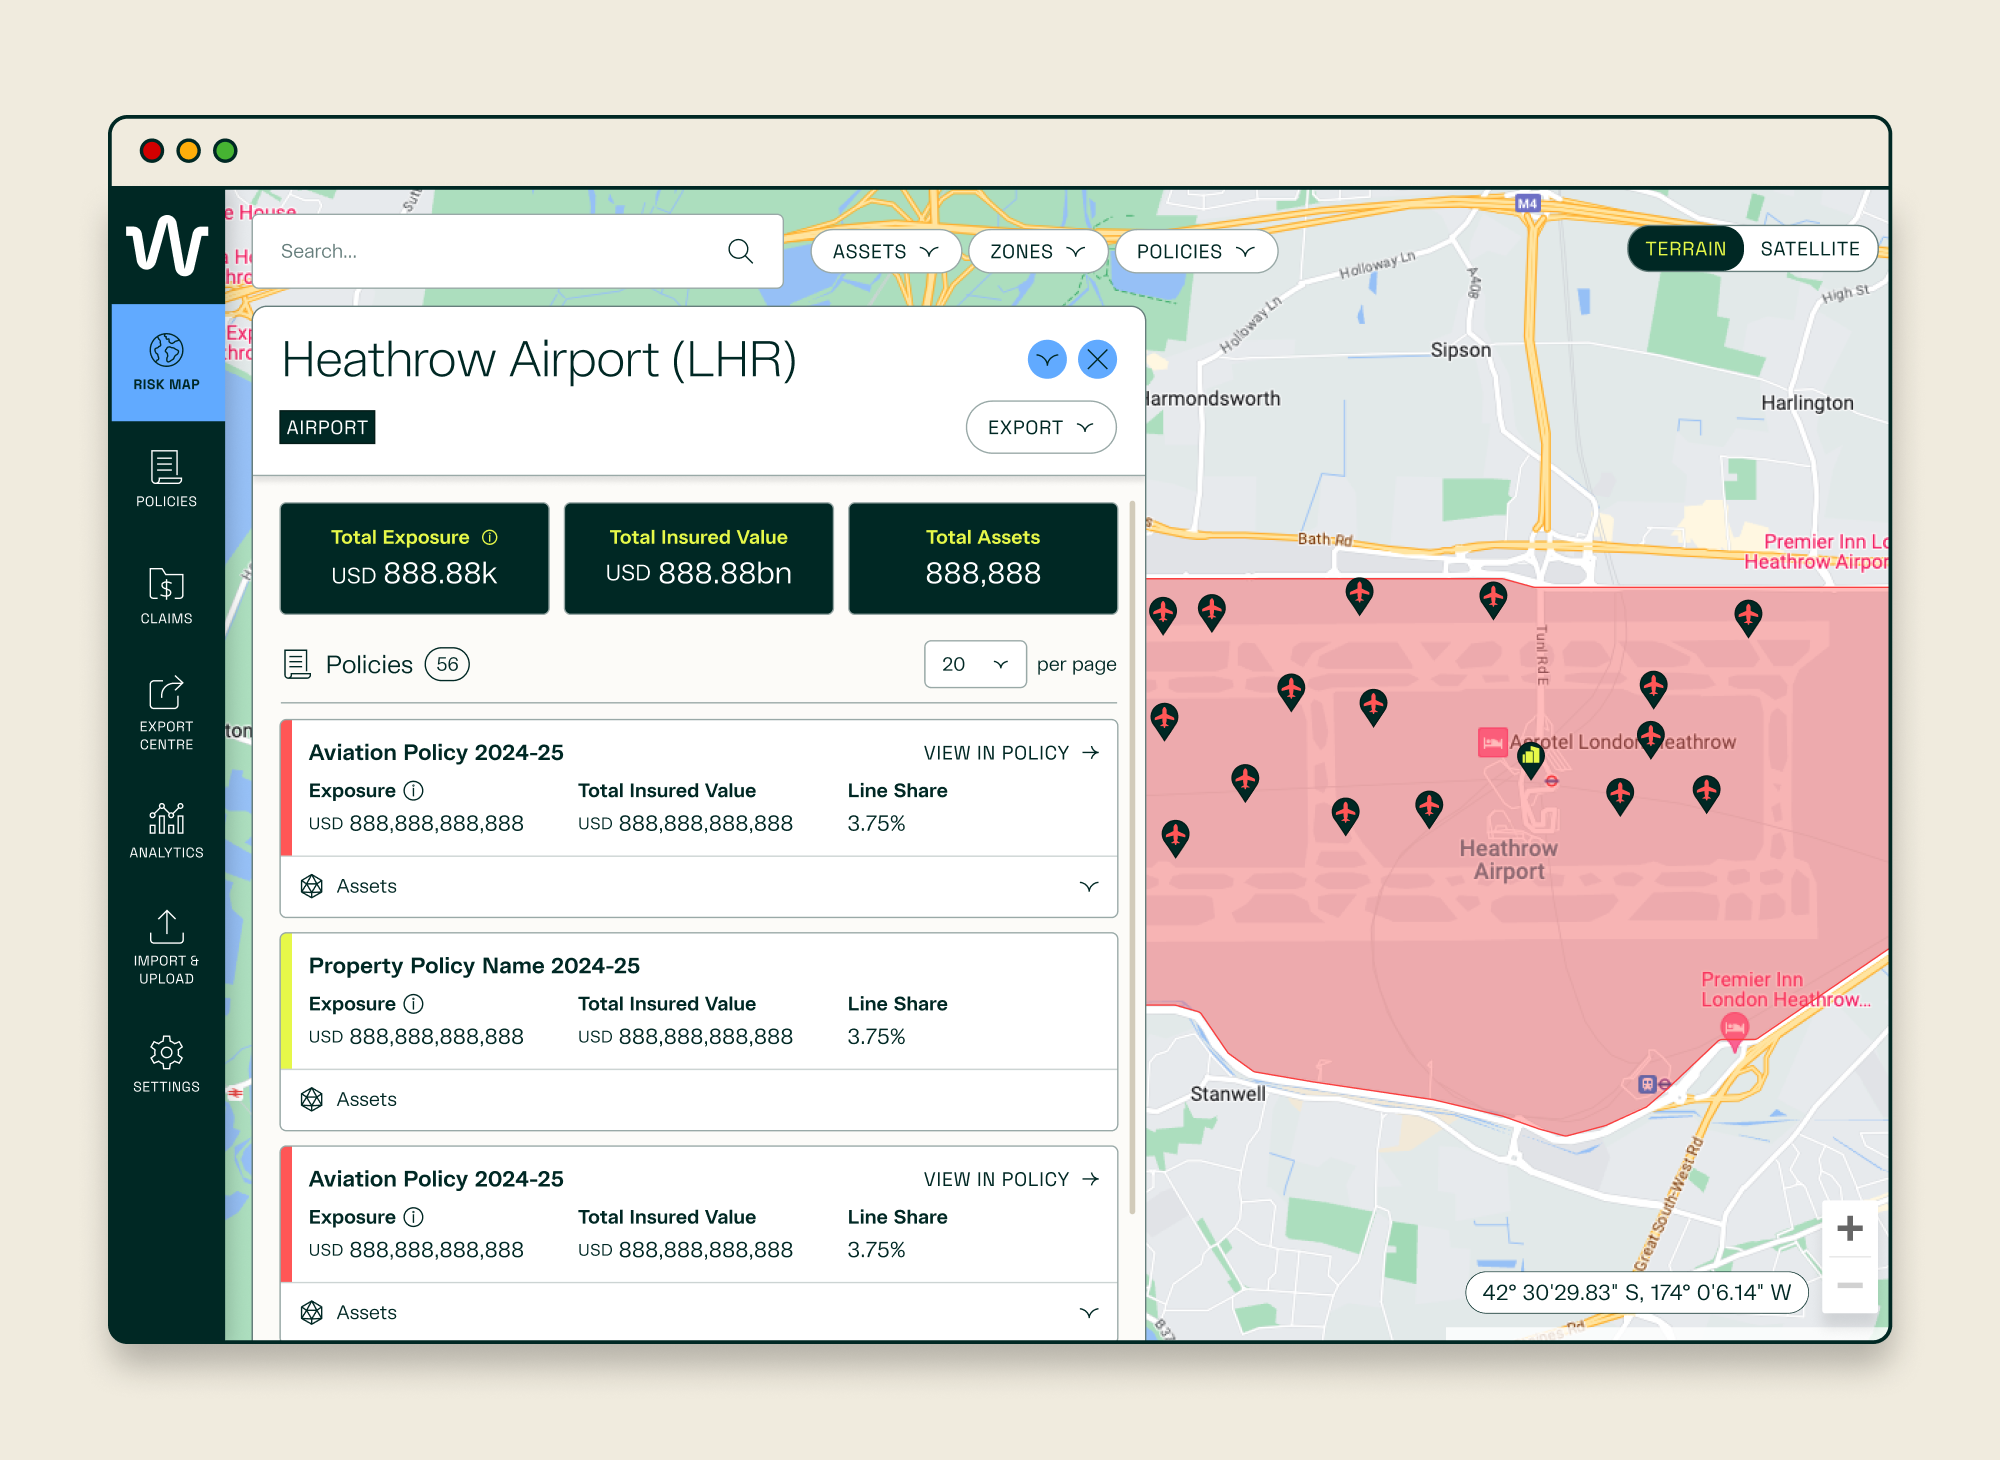
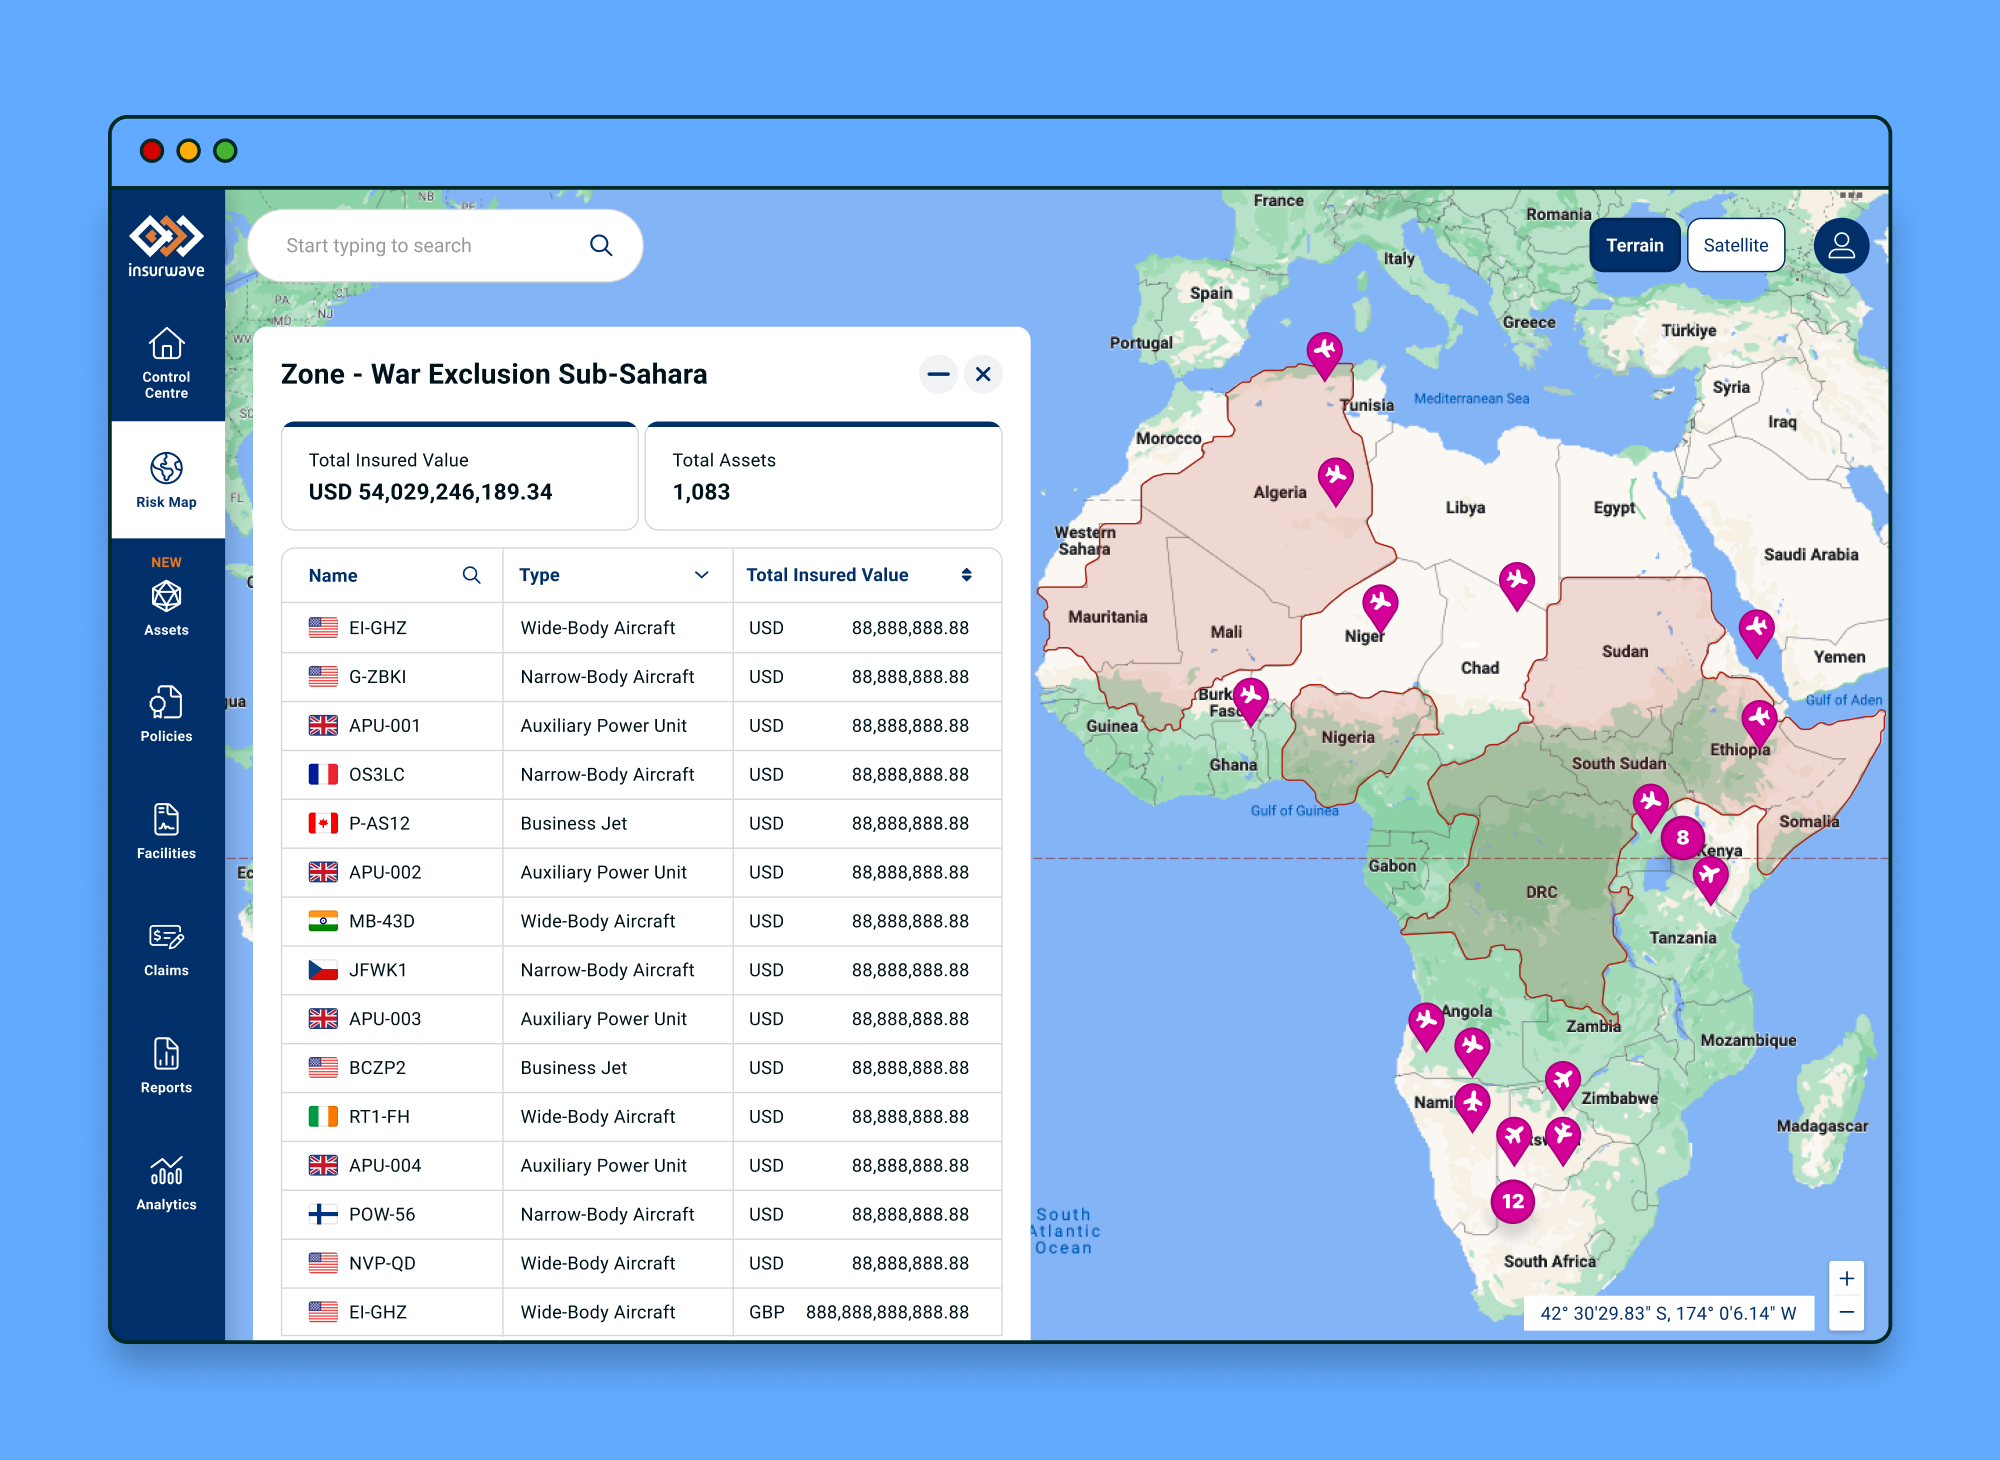
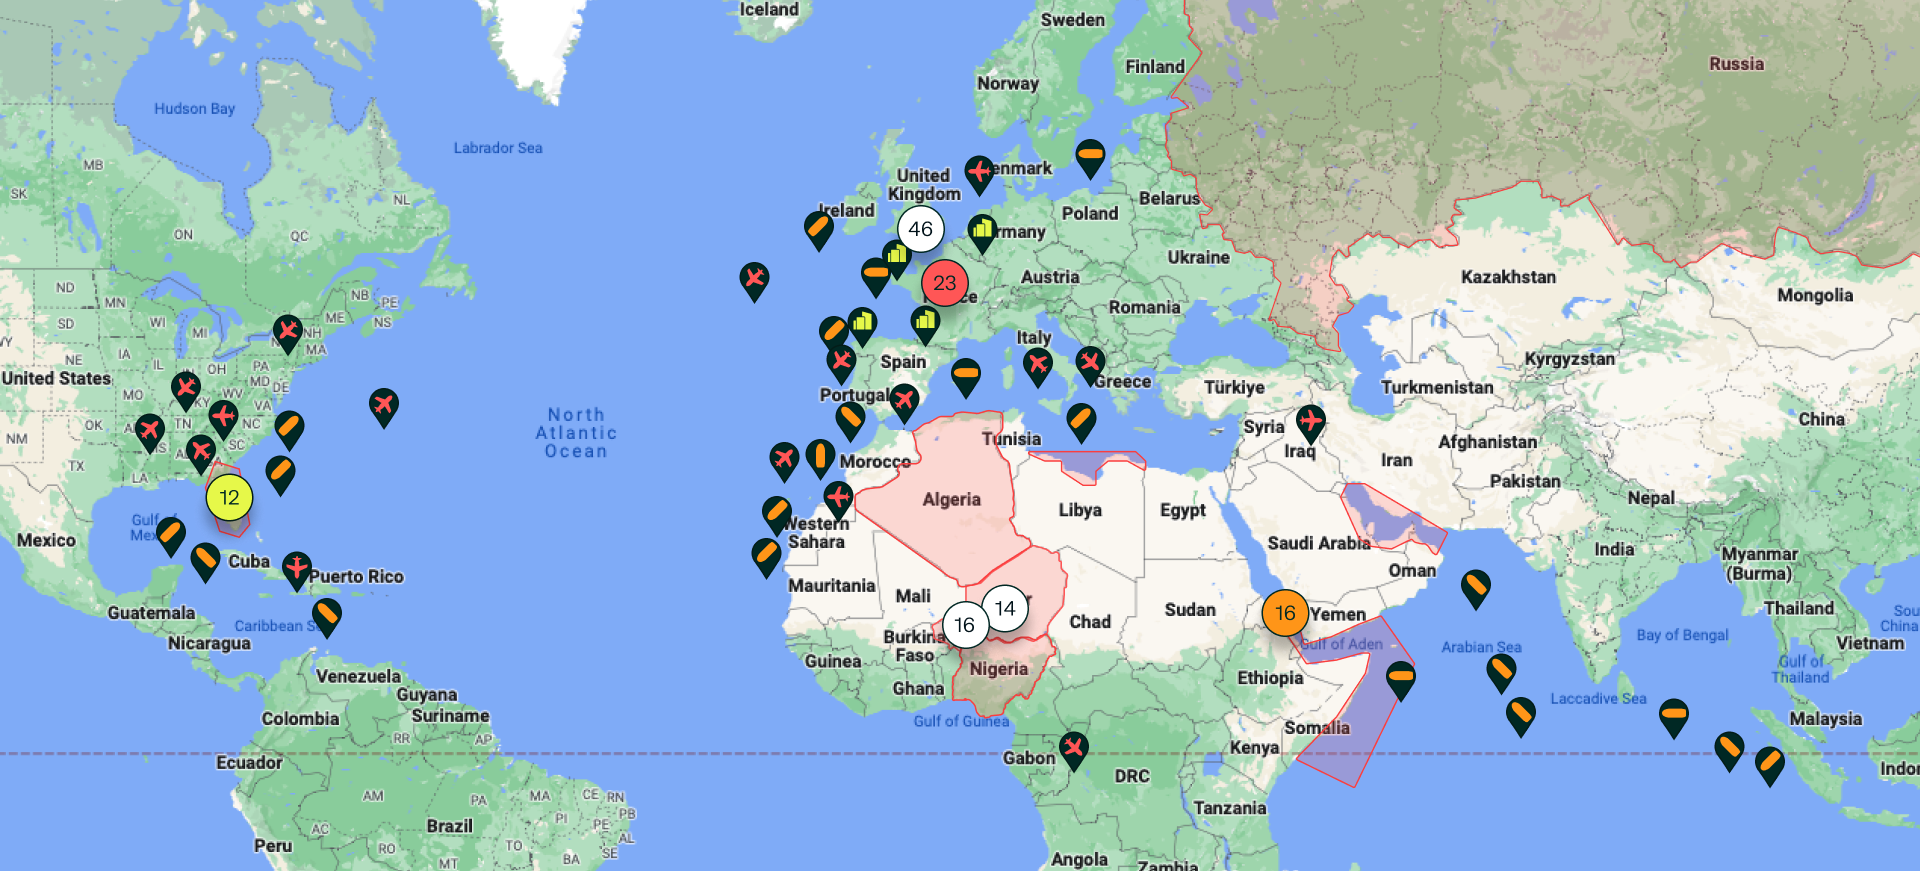
Zone Exposure Panel
Zone Panel Before
Export Centre - Zone Peak Exposure
Historic Point-In-Time Zone Exposure
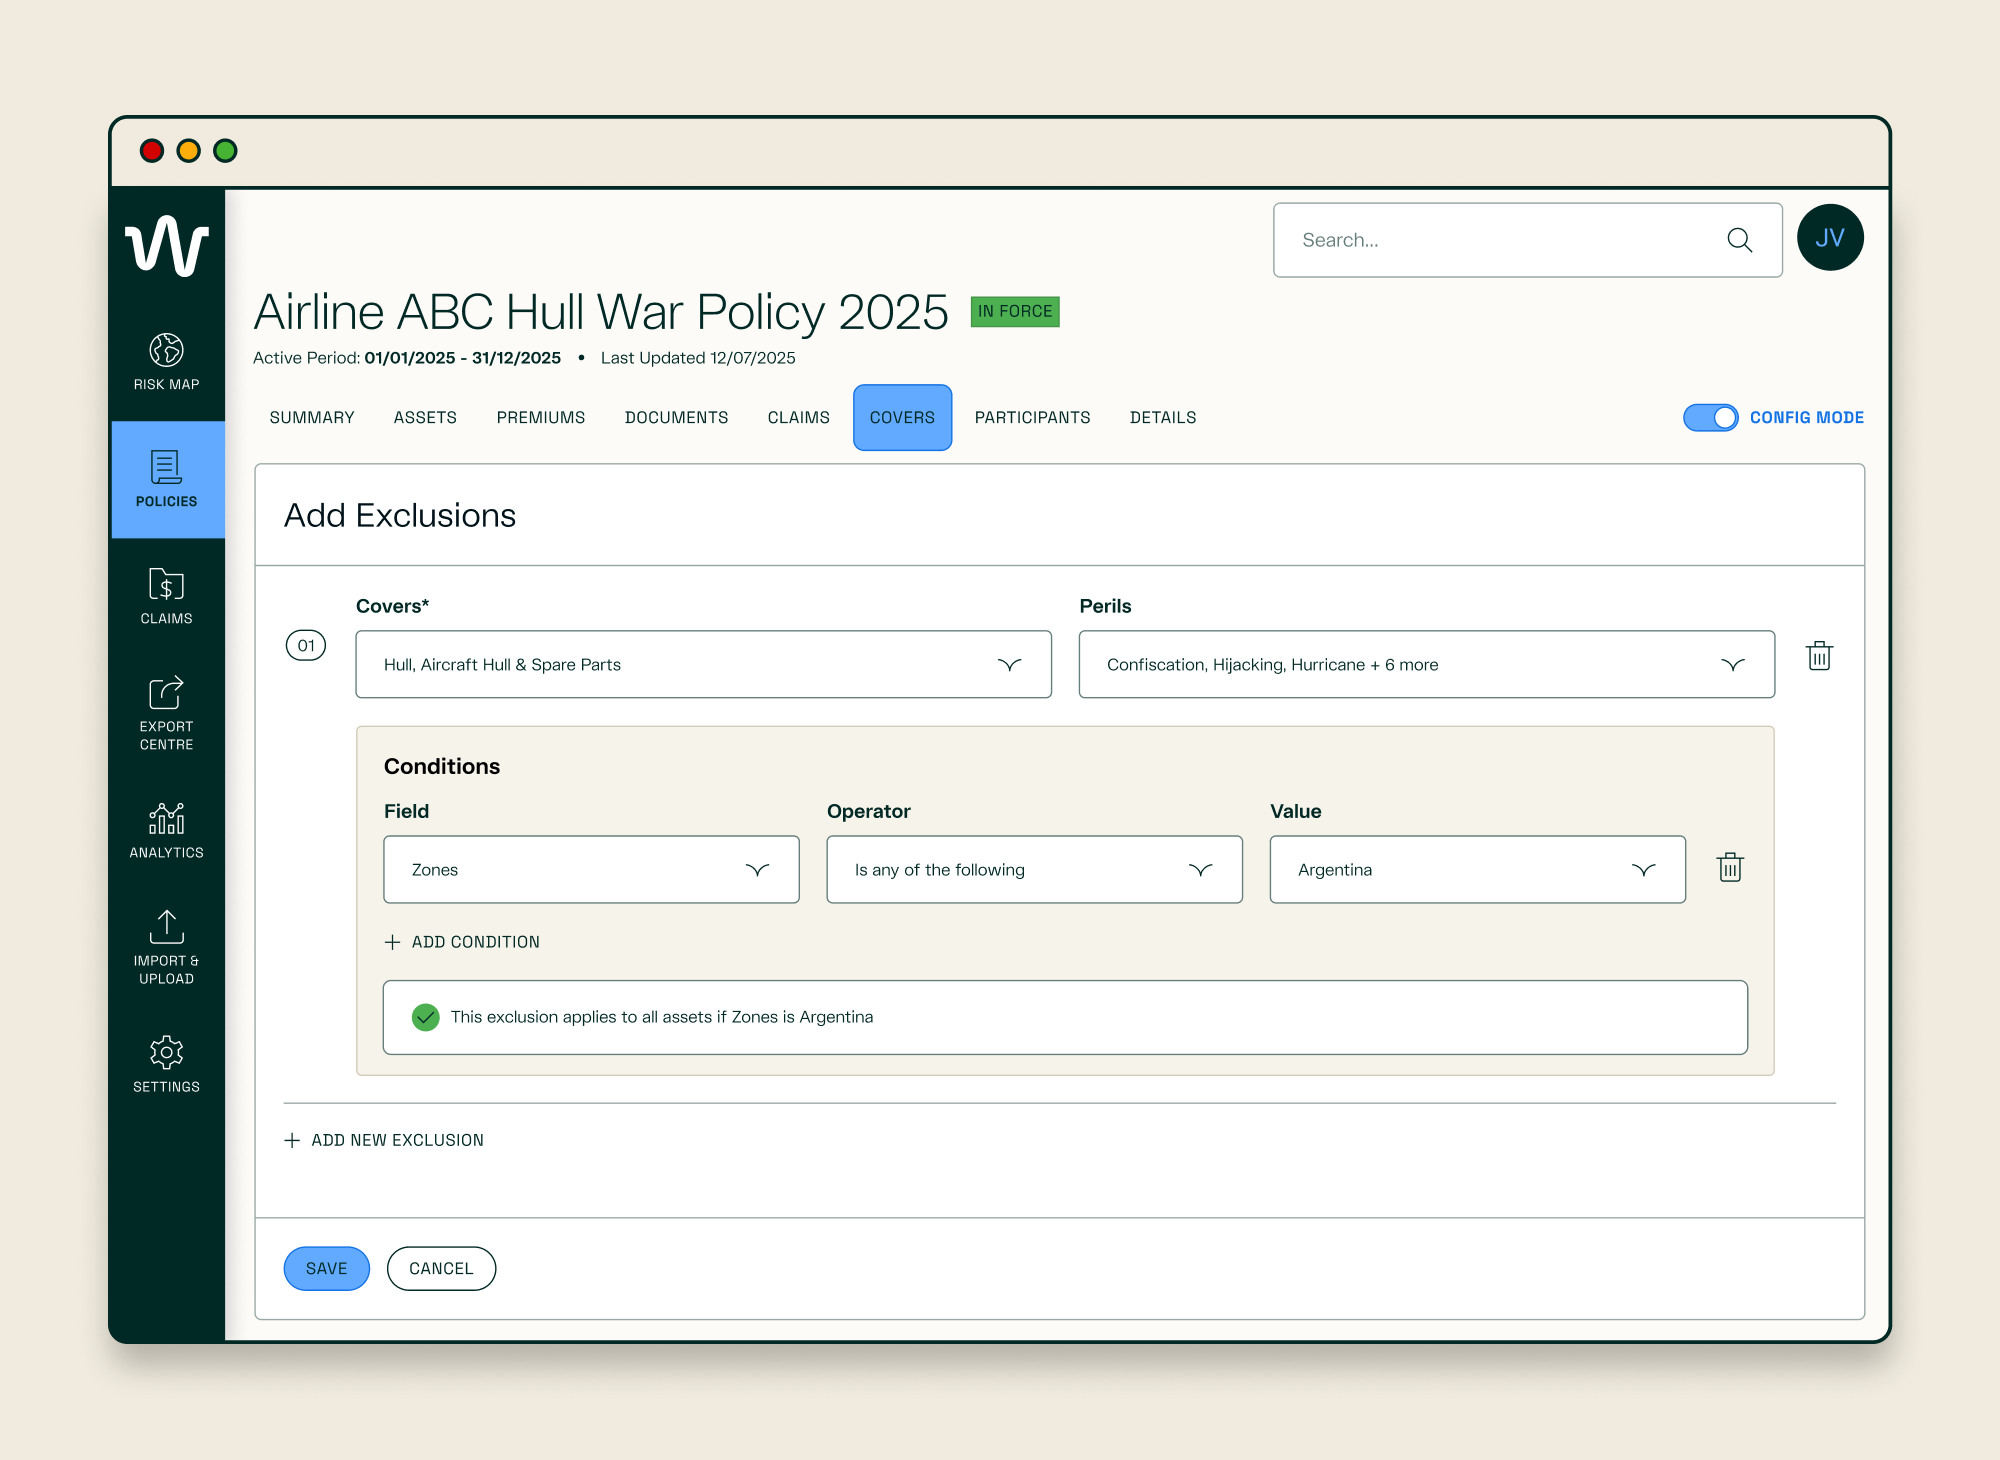
Policy Terms
Peak Zone Exposure Analytics
OVERVIEW
What is Exposure?
Exposure is the accumulation and aggregation of risk, with their respective policy terms applied, in any one geographical area for Insurers. The value that Insurwave brings to the specialty insurance market is a dynamic view of how much is exposed at any point in time for dynamic risk (such as aircraft and vessels) and static risk (such as properties) in geographical areas defined by zones.
My Role
As the Senior UX/UI Designer, I led Design to Build, closely collaborating with the Product and Engineering teams to deliver five outcomes that enhanced the Exposure product resulting in two new clients, and retaining all 10 existing clients.
THE PROBLEM
Insurwave had built features that could track dynamic risk (e.g. vessels & aircraft) and alert users when they had entered and/or exit zones on the map. At the same time, prospective Aviation Exposure clients were showing interest in the platform if they could also receive their exposure calculations within these zones.
THE opportunity
How might we design an exposure offering that provides value to Insurers of dynamic lines of business, driving revenue growth from new and existing clients?
By gaining new clients through leads and sales and cross selling to existing clients that were using the Marine Control product, the business saw an opportunity for revenue growth.
RESEARCH & DISCOVERY
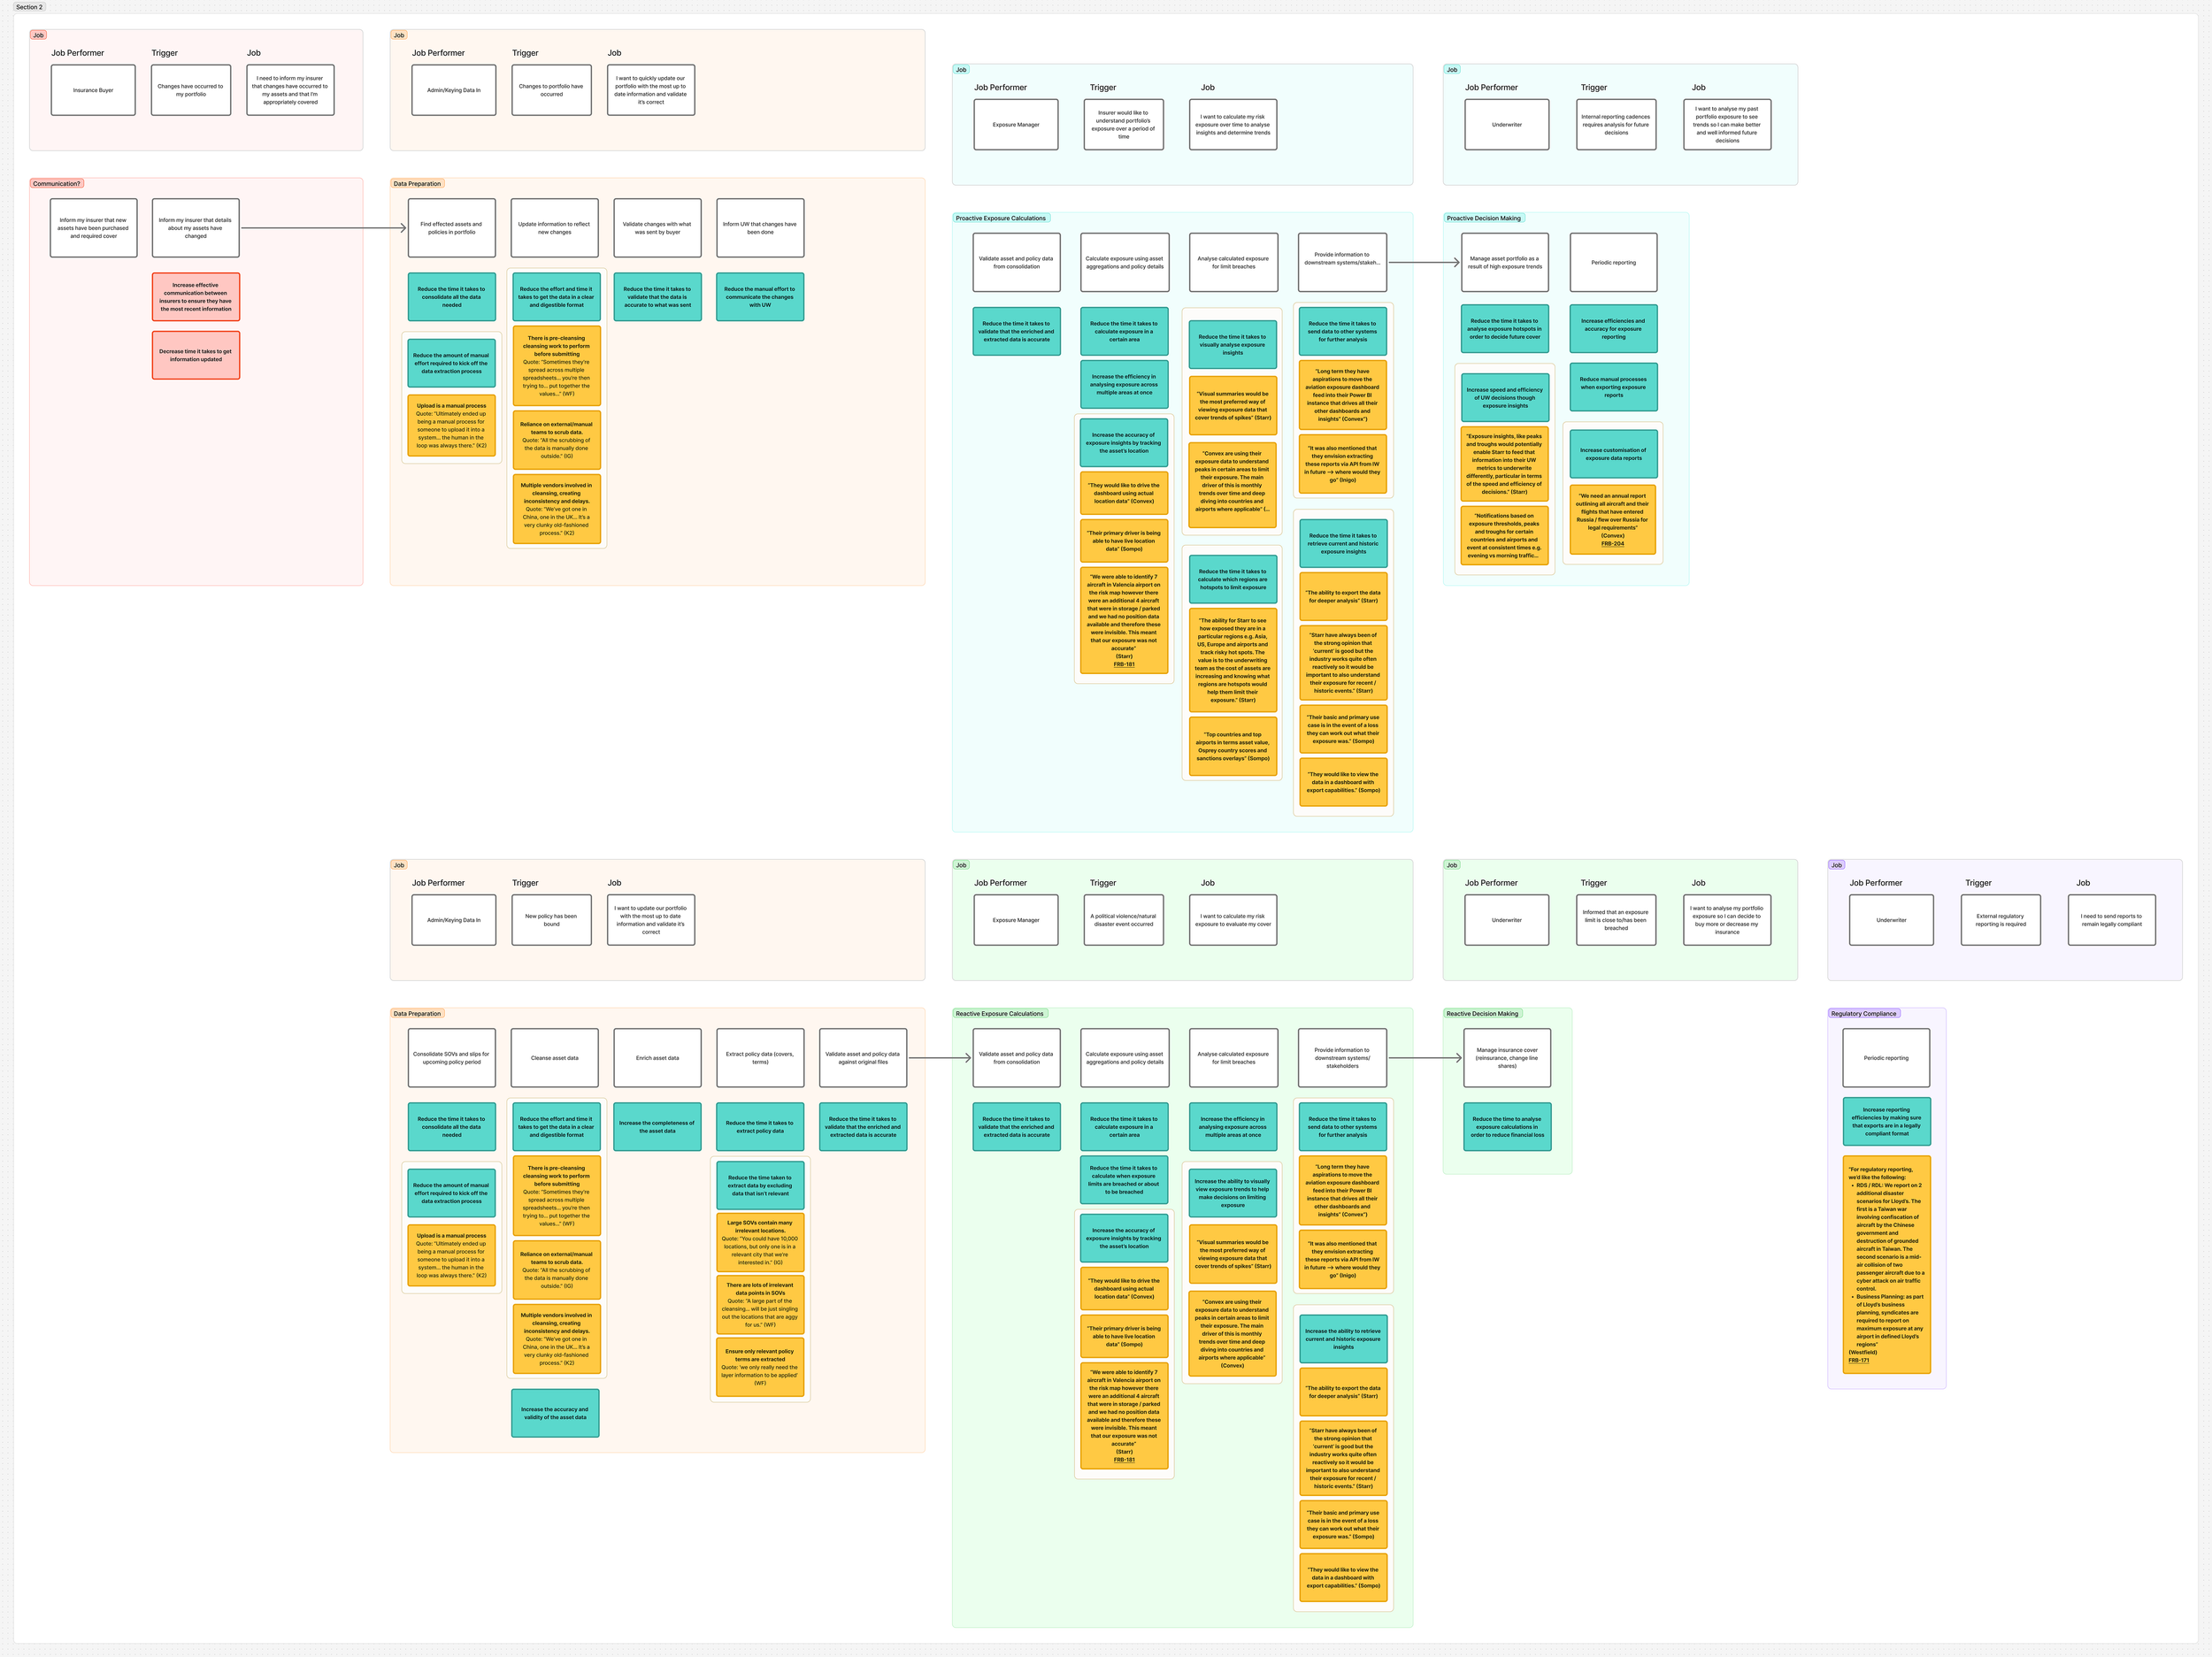
Initial interviews with potential clients were conducted by Sales and Product, with workshops later including Design to completely understand the struggles and problems with their workflows.
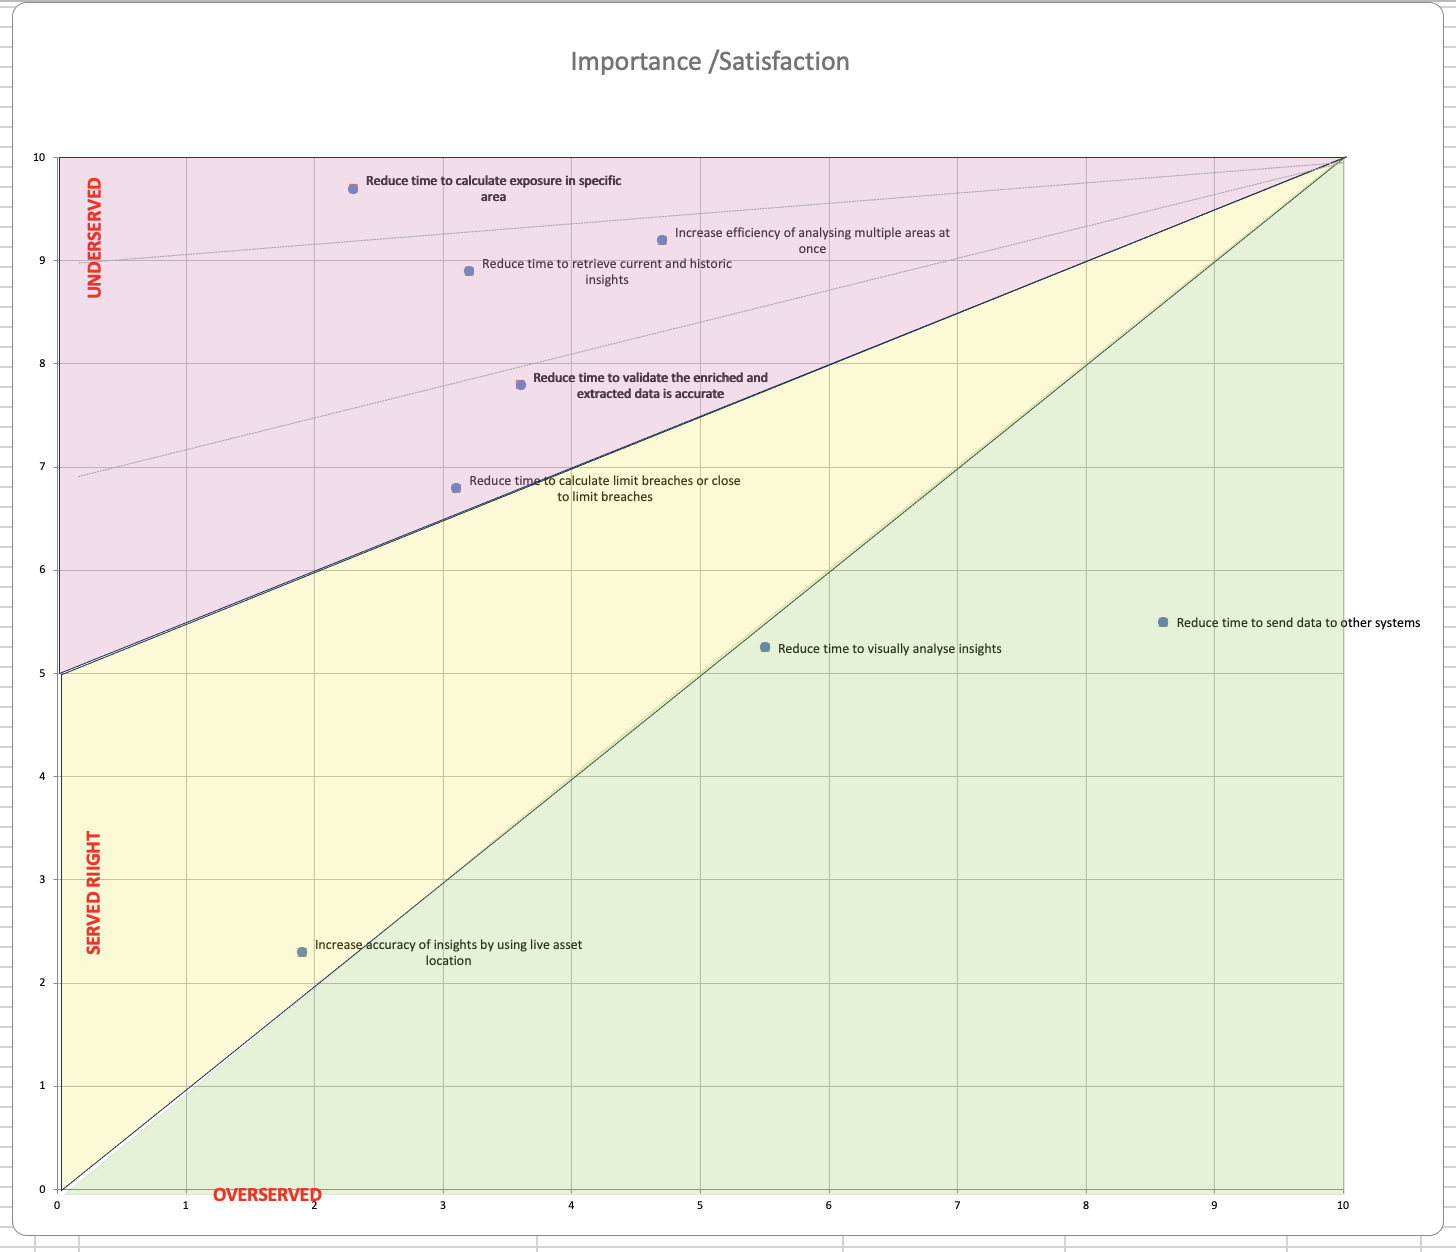
After creating a job map, and in turn an opportunity map using ratings from existing and potential clients, we were able to validate which outcomes we would need to create the Aviation Exposure product, so that Insurwave provided the most value.
During this process, there were changes in the Aviation insurance industry that required them to know where their insured aircraft were at all times, which further boosted Insurwave as an ideal solution, due to our existing functionality to track dynamic risks.
DESIGN SPRINT & WORKSHOPS
With assumptions of desirability being validated through the user interviews, and viability being validated by the new strategic direction from senior leadership, we were now at the point to test feasibility.
After consolidating research on what existing and potential clients would be interested in, but also confirming how they currently calculate their exposure, we ran a design sprint with Product, Engineering, Design, and Data to investigate how we could design a solution that utilised current features, what we would need to additionally build to make it successful, and highlighted any major concerns or blockers.
We broke down the product roadmap into five outcomes so that we could iteratively release value without waiting, gain feedback after each one, and consolidate enhancements with the next iteration.
outcomes
calculate & export current zone exposure
Using existing calculations of Total Insured Value (TIV) of an asset, coupled with tracking data, we could calculate the Total TIV of all assets within a zone. The outcome was to display these calculations on the UI, so we redesigned the current Zone panel to include all of this information, and also include the policies that these assets were on.
With Zone Exposure data now available on the platform UI, users gave us feedback that they would like to extract the data so that they could ingest it into downstream forecasting systems. We designed an Excel extract that was formatted in a way that multiple clients could use, and updated the UI to easily export this data from the Zone Exposure panel.
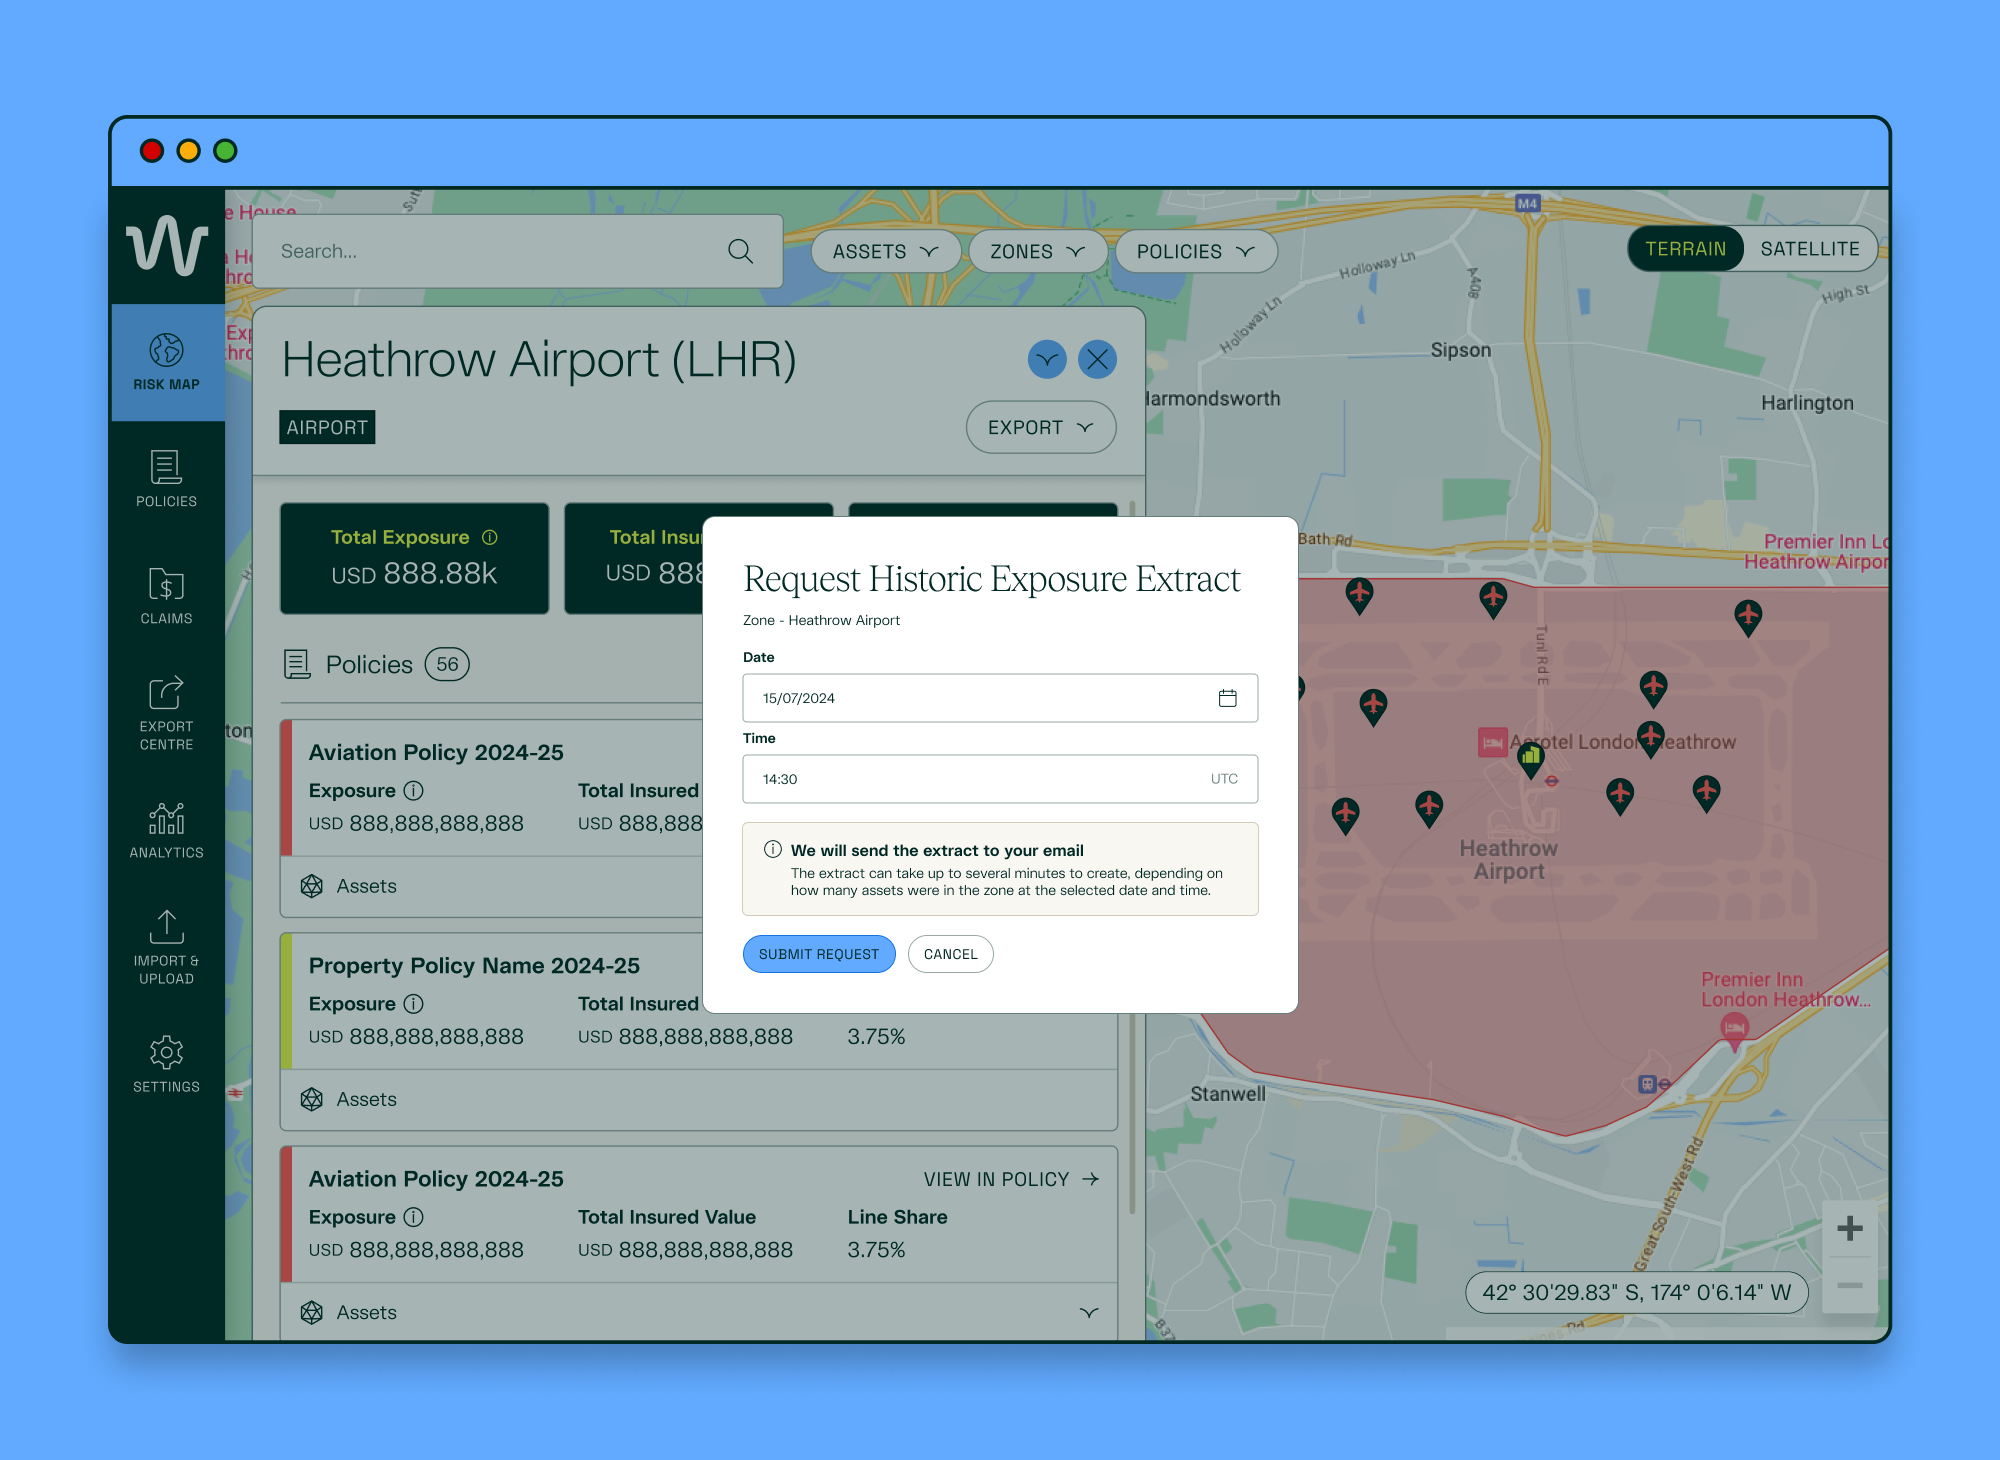
historic point-in-time zone exposure
The natural evolution (and validated from user feature requests) was being able to generate an extract for Zone Exposure for a specific date and time. This required designing from Engineering for the back-end logic to make sure the data being used was as accurate as possible for the Exposure calculations, but also updates to the UI to allow users to request the extract.
POLICY TERMS ON THE PLATFORM
After some more user feedback, to calculate ‘True Exposure’, the calculations had to also include policy terms, such as Line Share, Limits, and Exclusions. In order to use these in calculations, they needed to be added and stored on the platform, which they currently weren’t. We updated the Covers section in Policies to include Perils, Limits, Exclusions, and Deductibles and any conditions, so that we could start aiming for a True Exposure calculation.
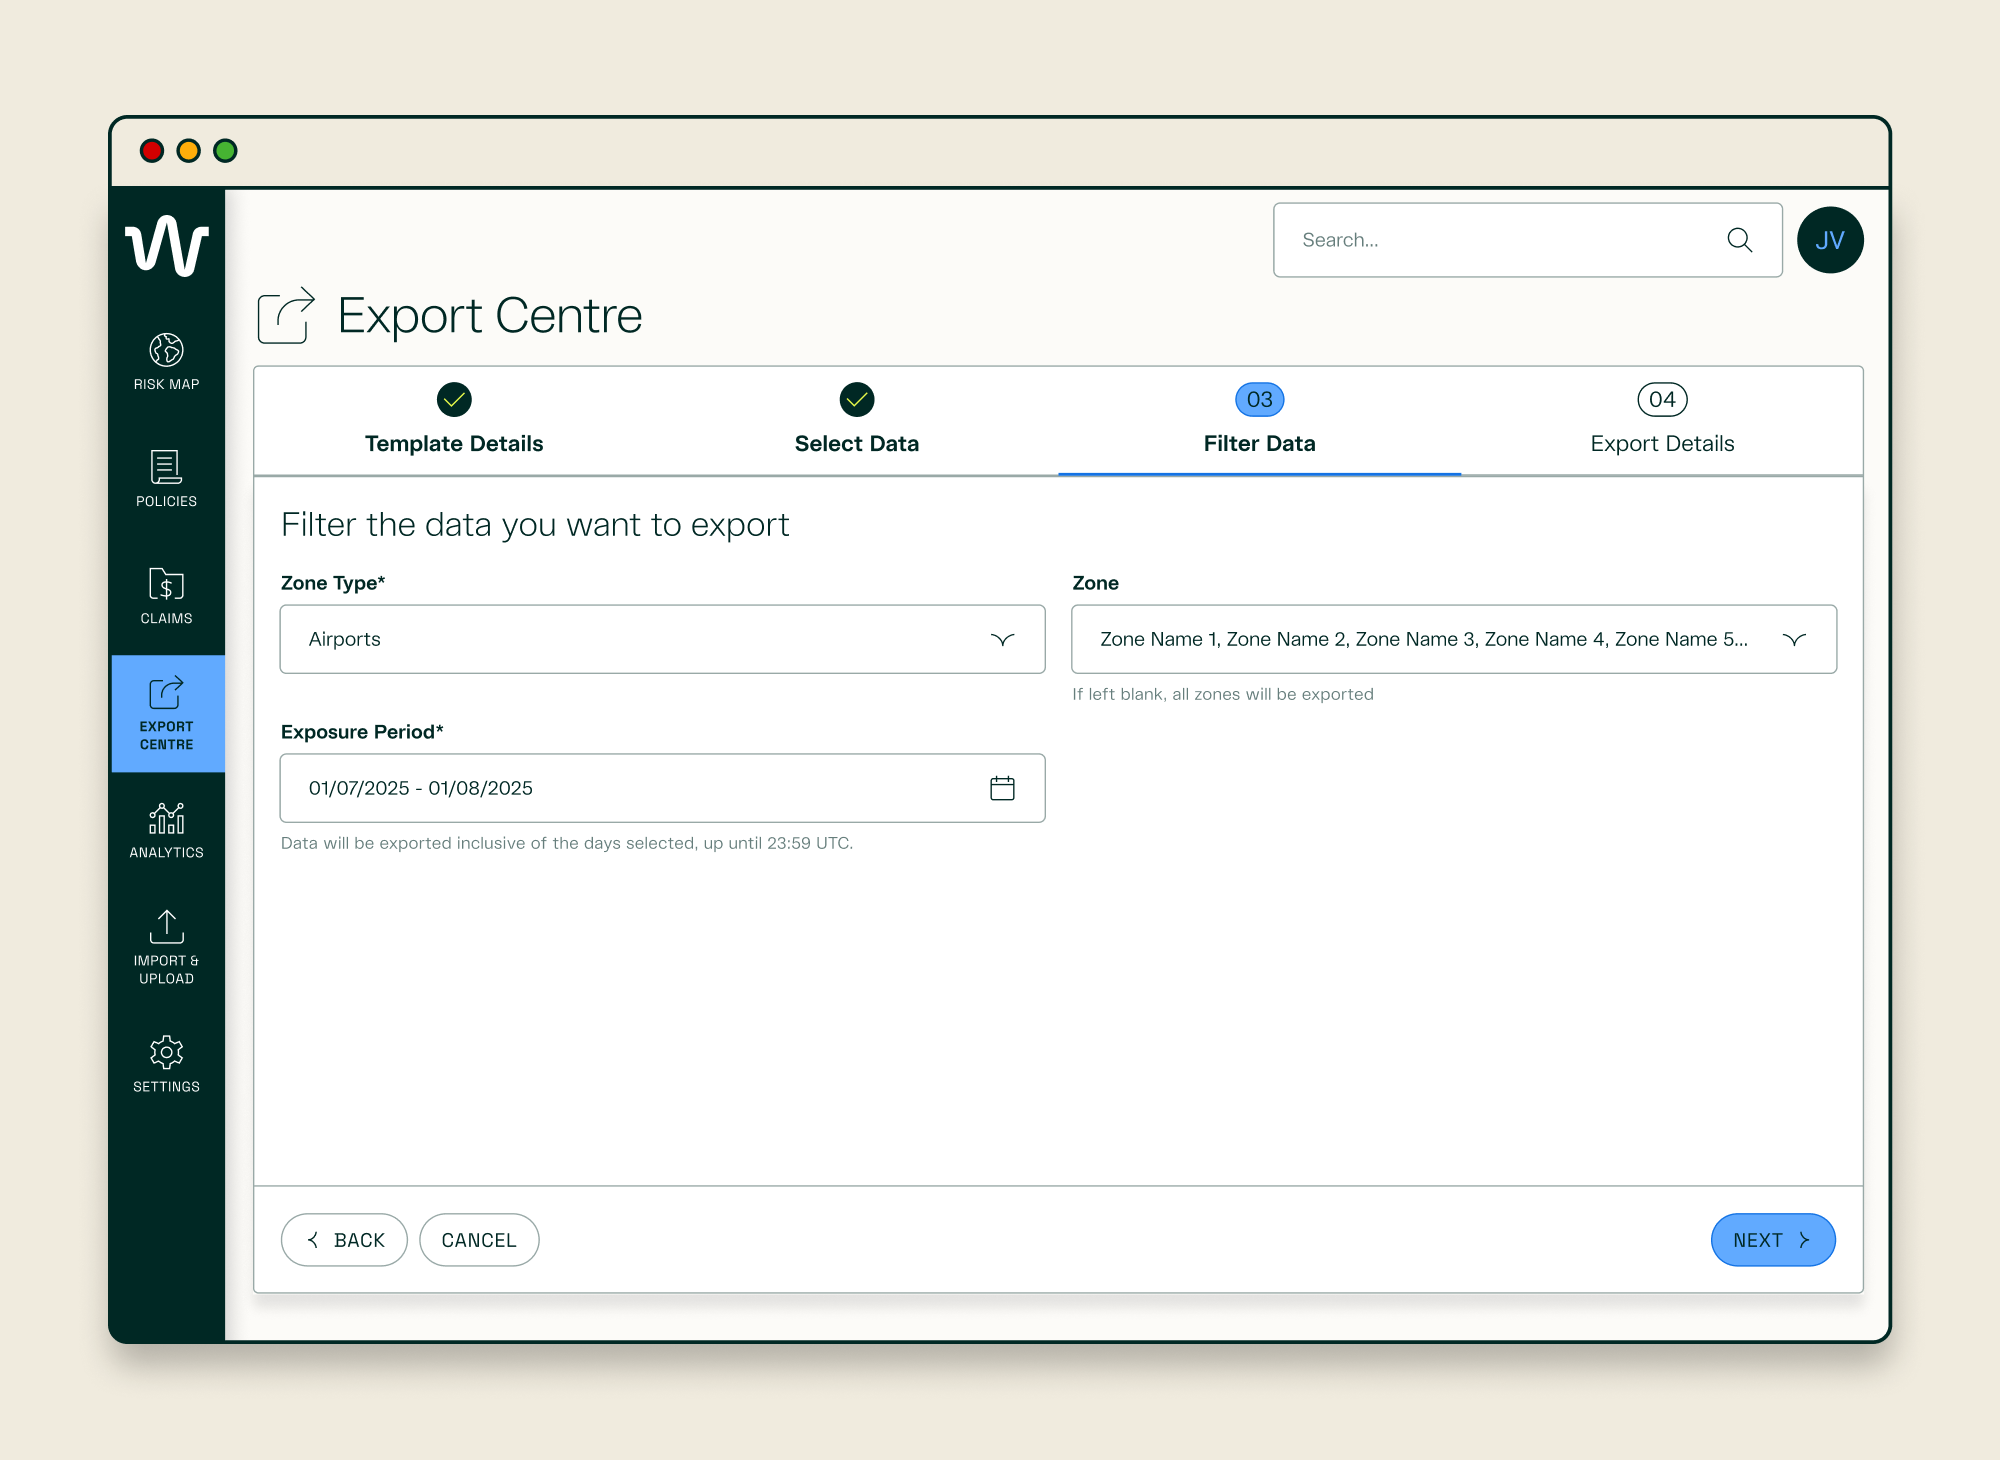
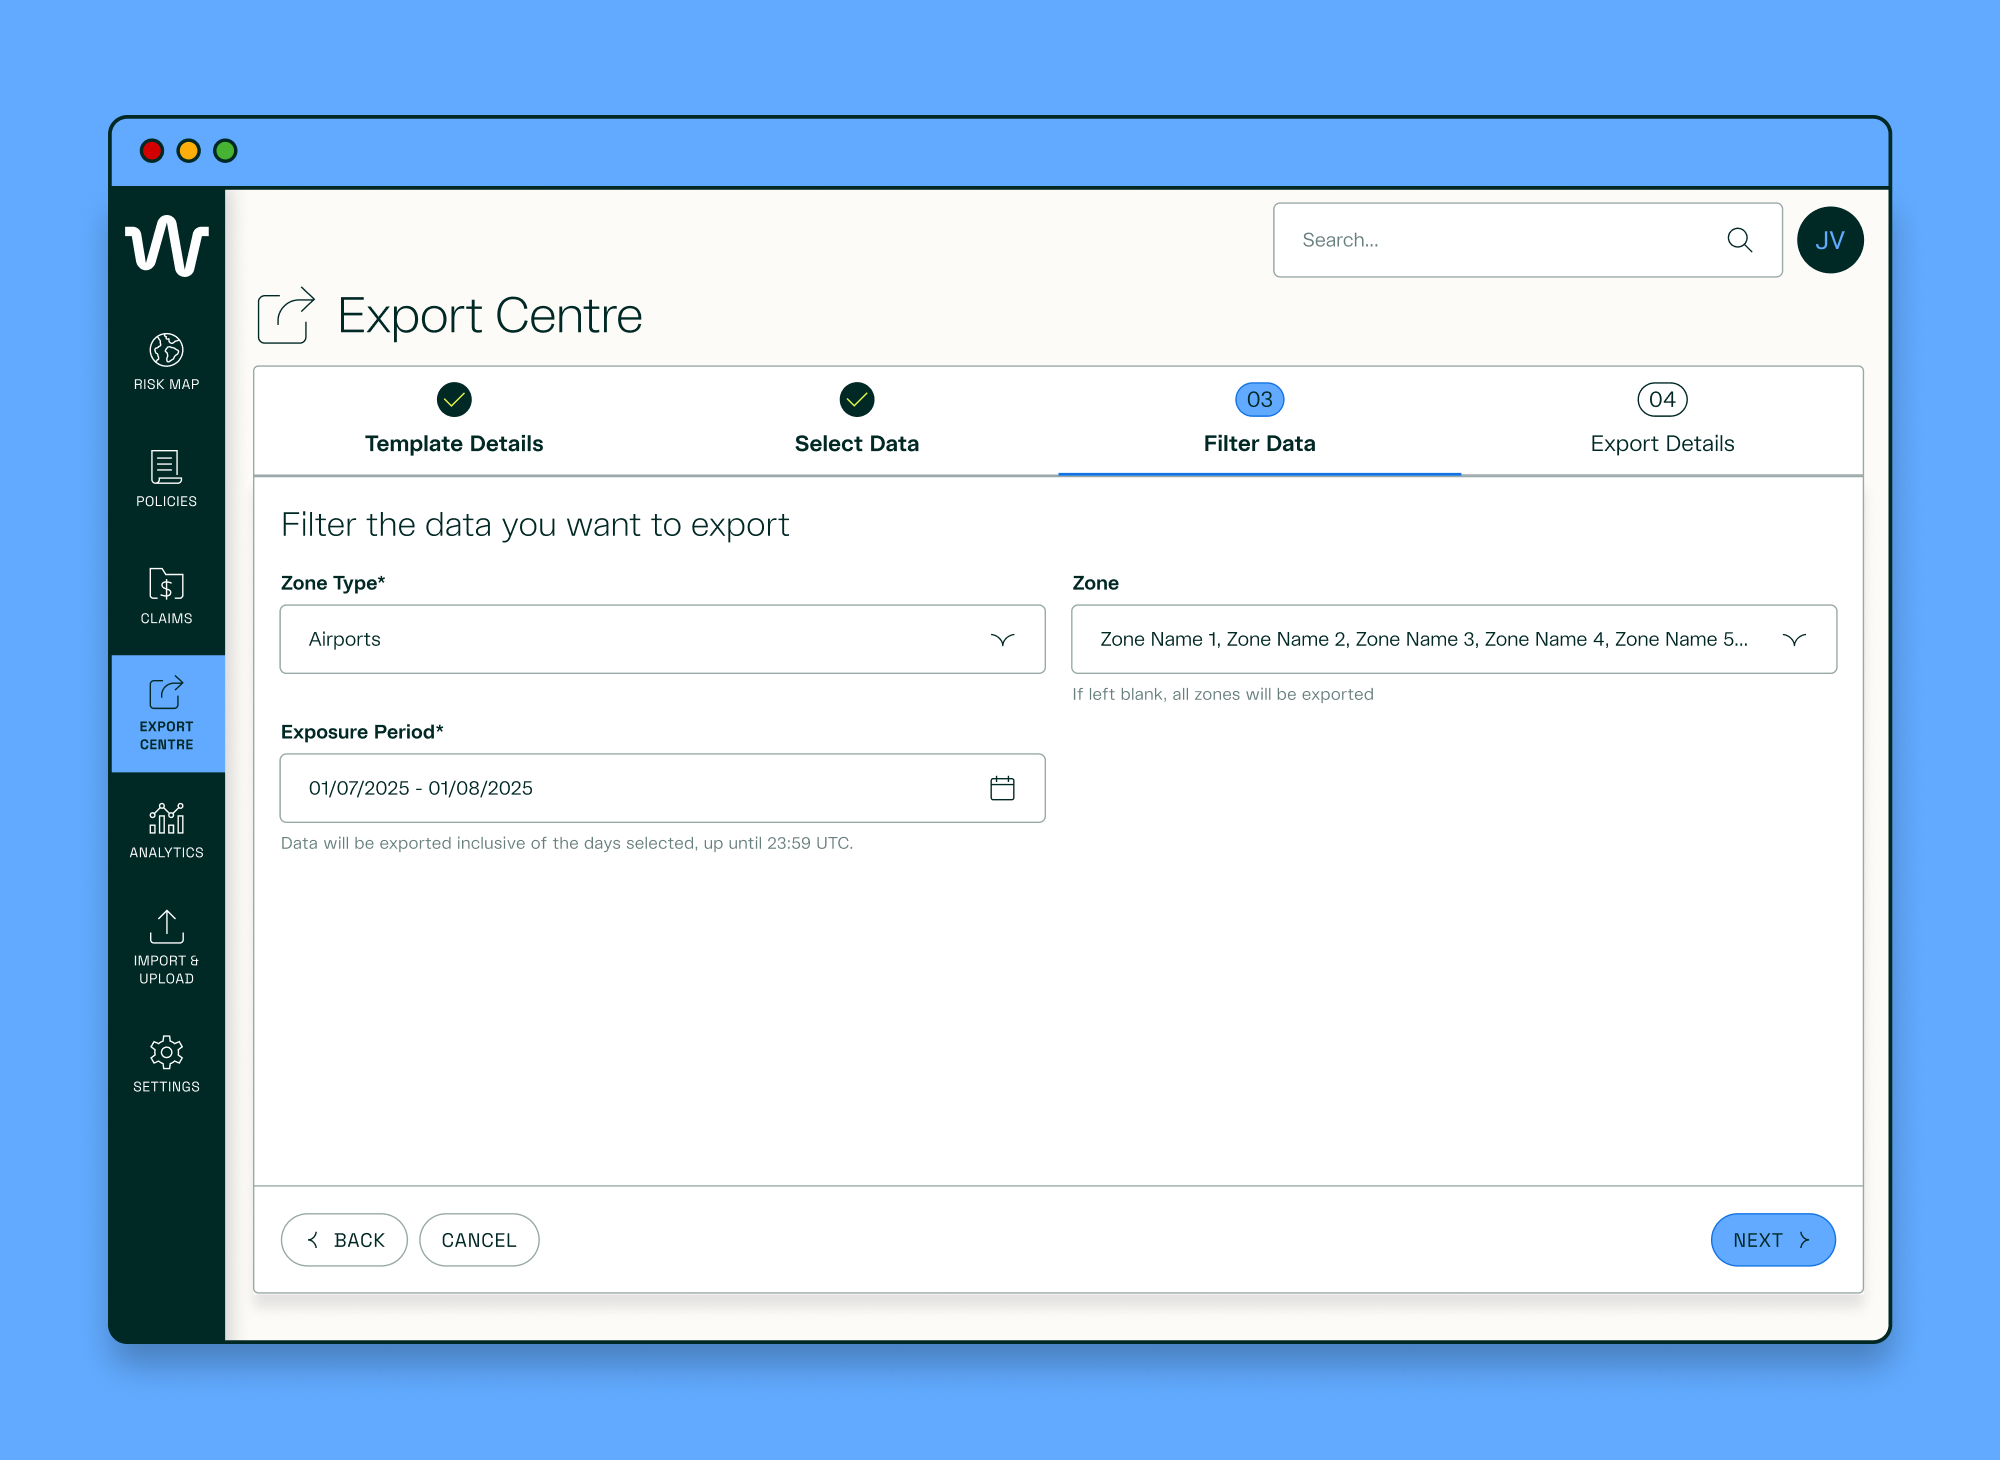
historic range zone peak exposure
The uptake on the previous Historic Point-In-Time Exposure release was high, however, we noticed that users were using the feature to get ranges of time by using it multiple times, but with different points in time. After validating that this was the case, and with the addition that day ranges would also be useful, we designed a completely new Export Centre to help solve for this need.
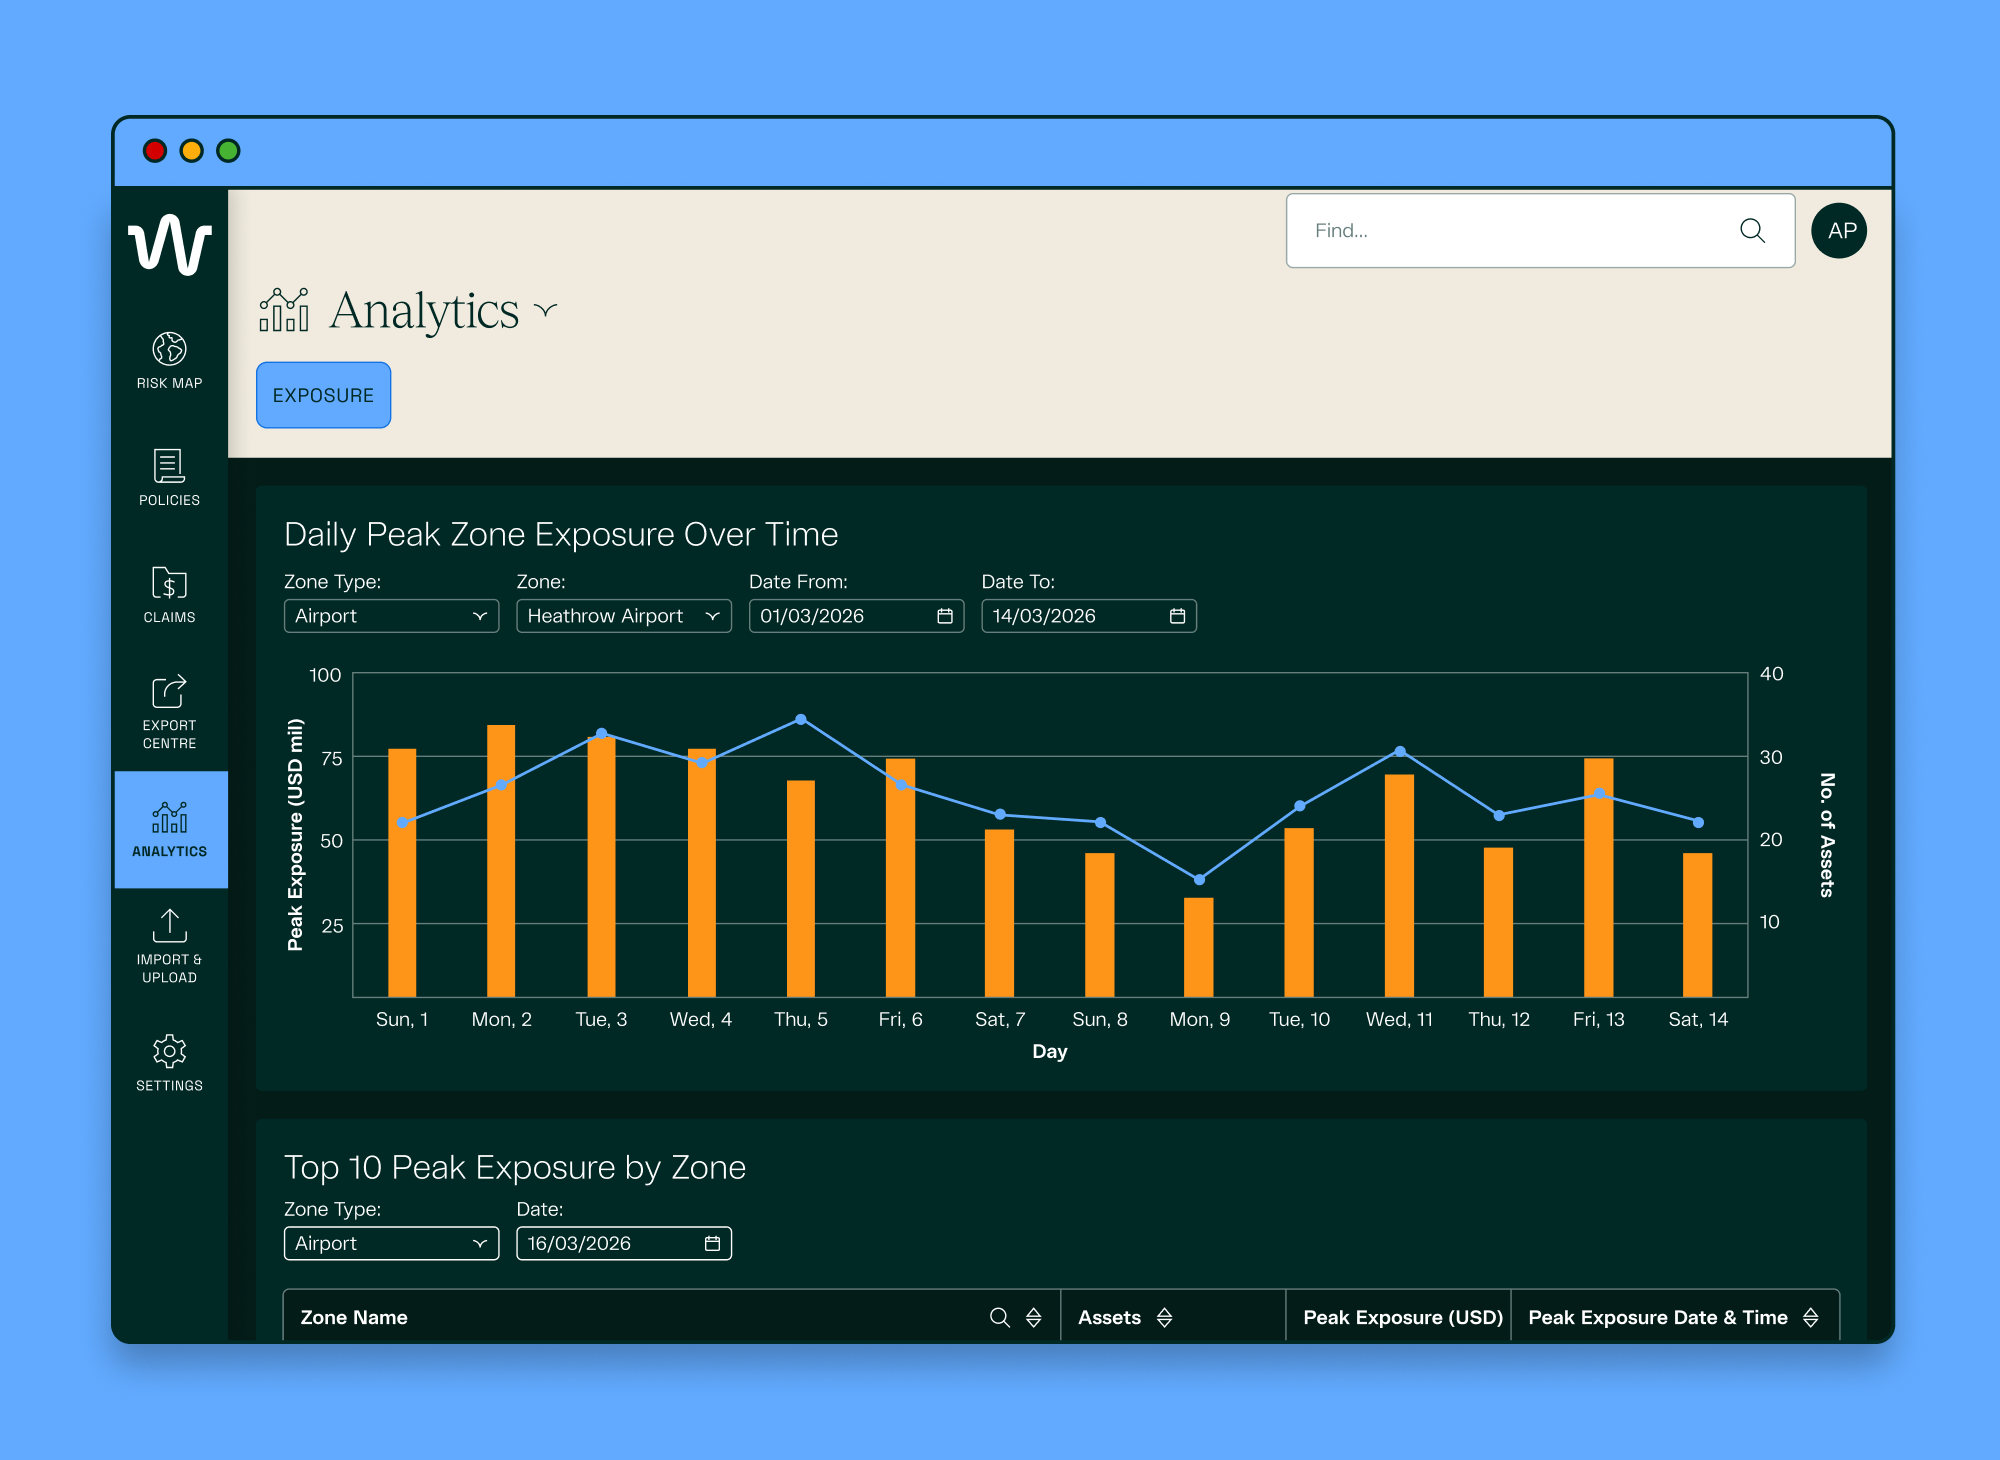
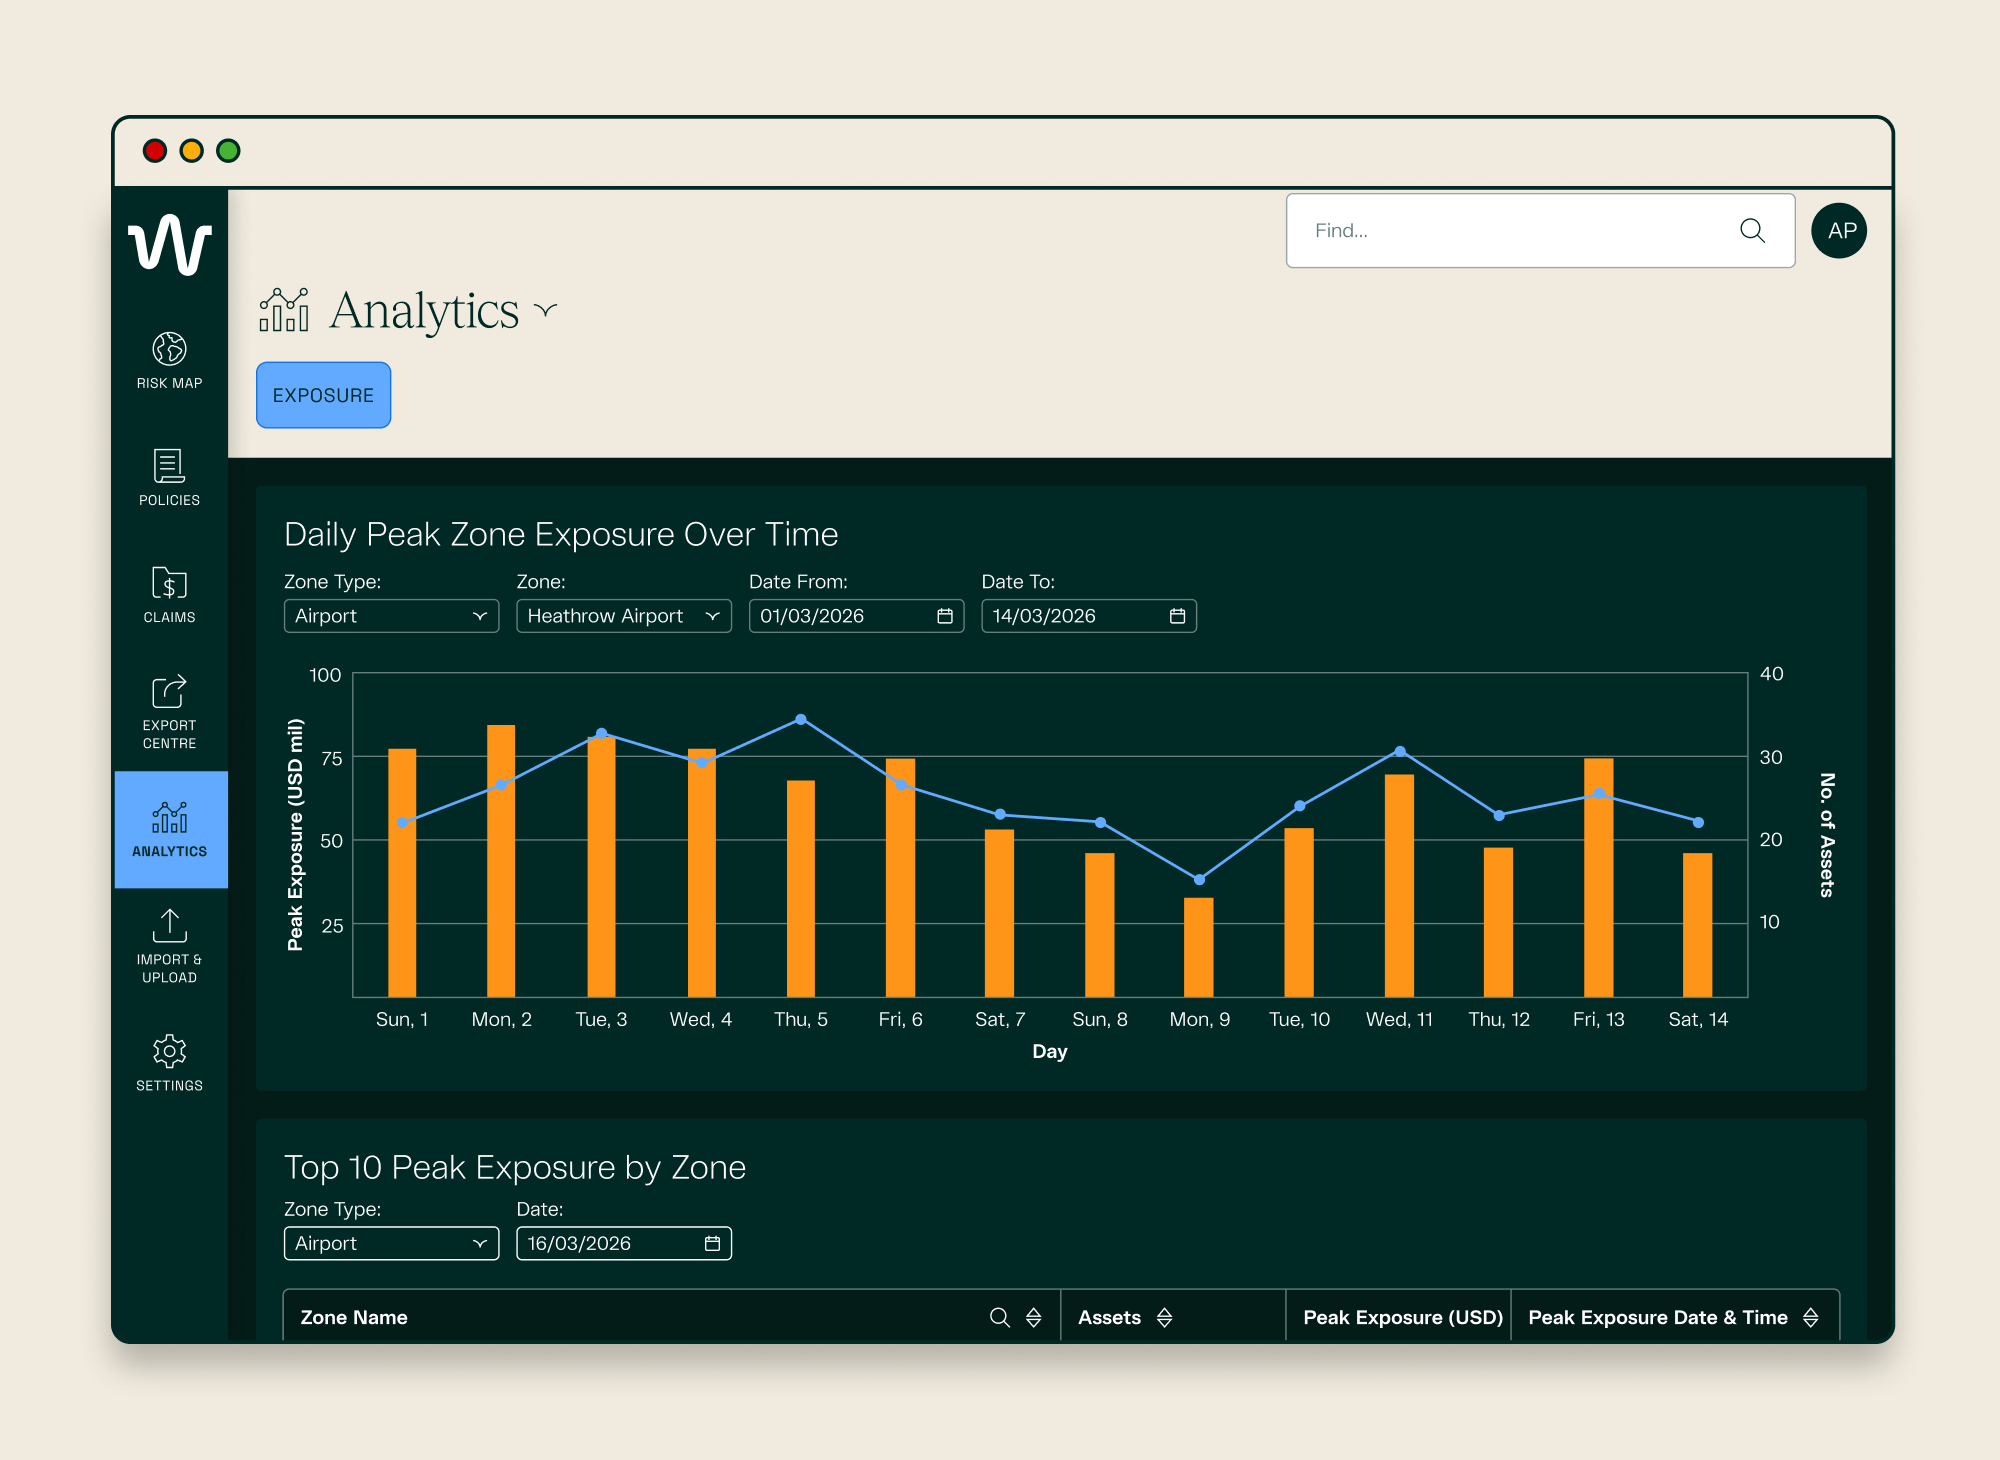
zone exposure analytics
With all of the Historic Zone Exposure data on the platform, we wanted to create even more stickiness with our users by making it a source of insights and trends. With some further user interviews conducted, we also realised that users were looking at peaks, minimums and average exposure in zone for their forecasting and reporting.
OVERALL RESULTS
OVERALL RESULTS
From the start of 2025, there were 6 leads that turned into 2 new clients (33.33%) that purchased for the Aviation Exposure product.
We had 8 existing Aviation Exposure clients and retained 8 of them (100%).
We also had 2 existing Marine Control clients that purchased the Aviation Exposure product to their contract.
CLIENTS
For each released outcome/feature, we saw:
Current Zone Exposure Export:
Historic Point-In-Time Zone Exposure Export:
Policy Terms:
Historic Range Peak Zone Exposure Export:
Historic Exposure Analytics: